Overview
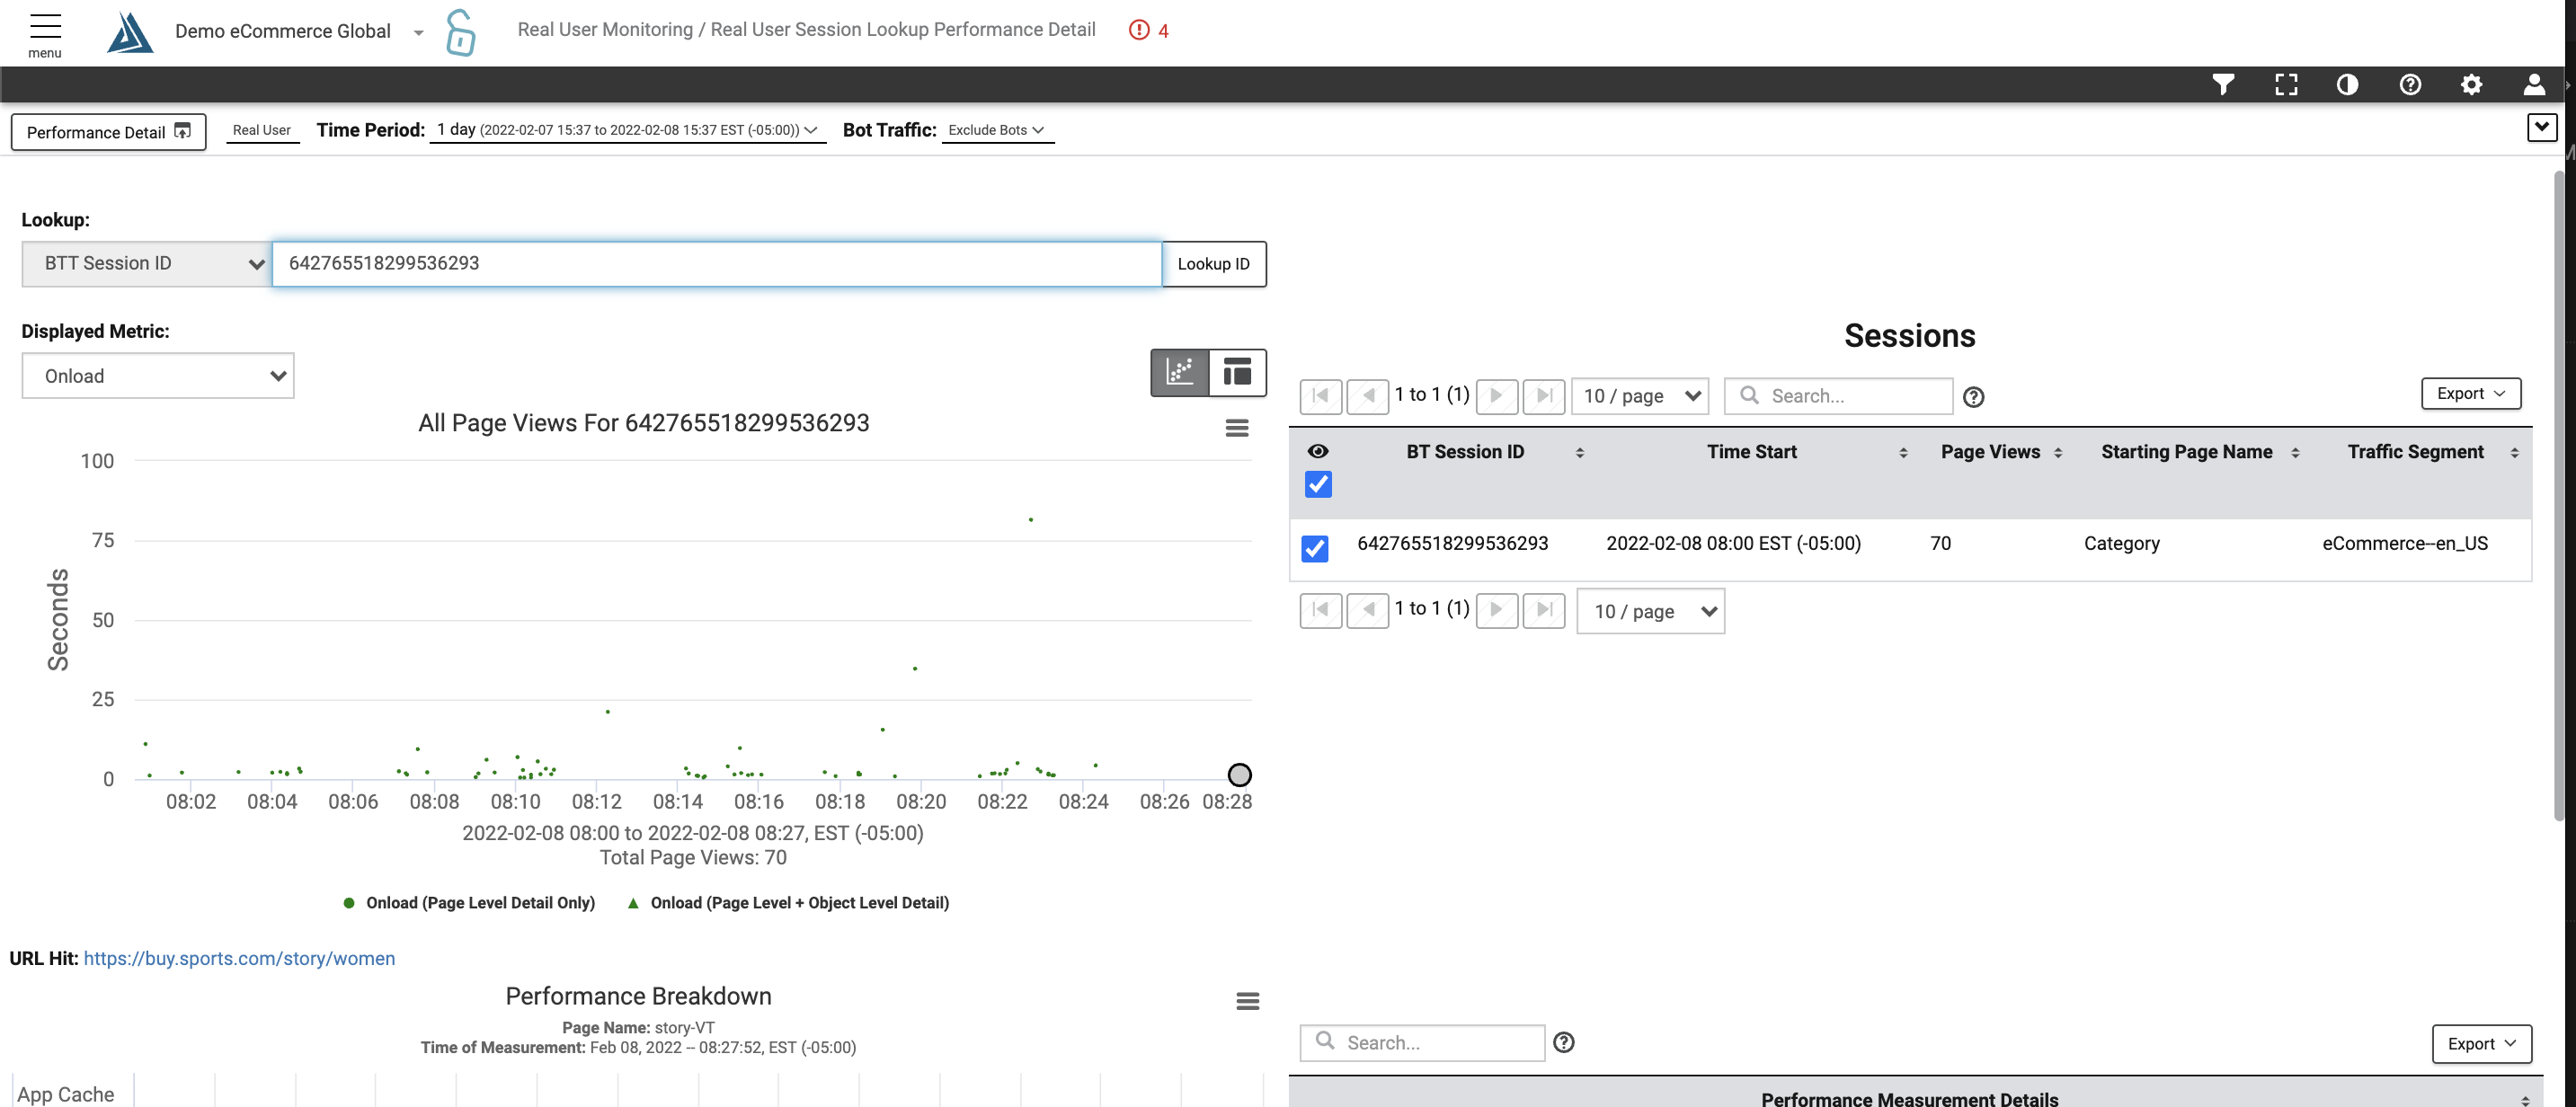
The RUM Session Lookup page allows you to view the performance metric details of a specific session. This page also features widgets displaying the data for the Displayed Metric selected from the dropdown menu as a graph. There is an article and short video explaining the RUM Performance Detail Page available here.
Accessing the RUM Session Lookup Page
The RUM Session Lookup Page is available on the RUM Performance Detail Page, available through the left side navigation menu under Real User Monitoring in the Blue Triangle Portal. From the Performance Detail page, there are two options for viewing session lookup data.
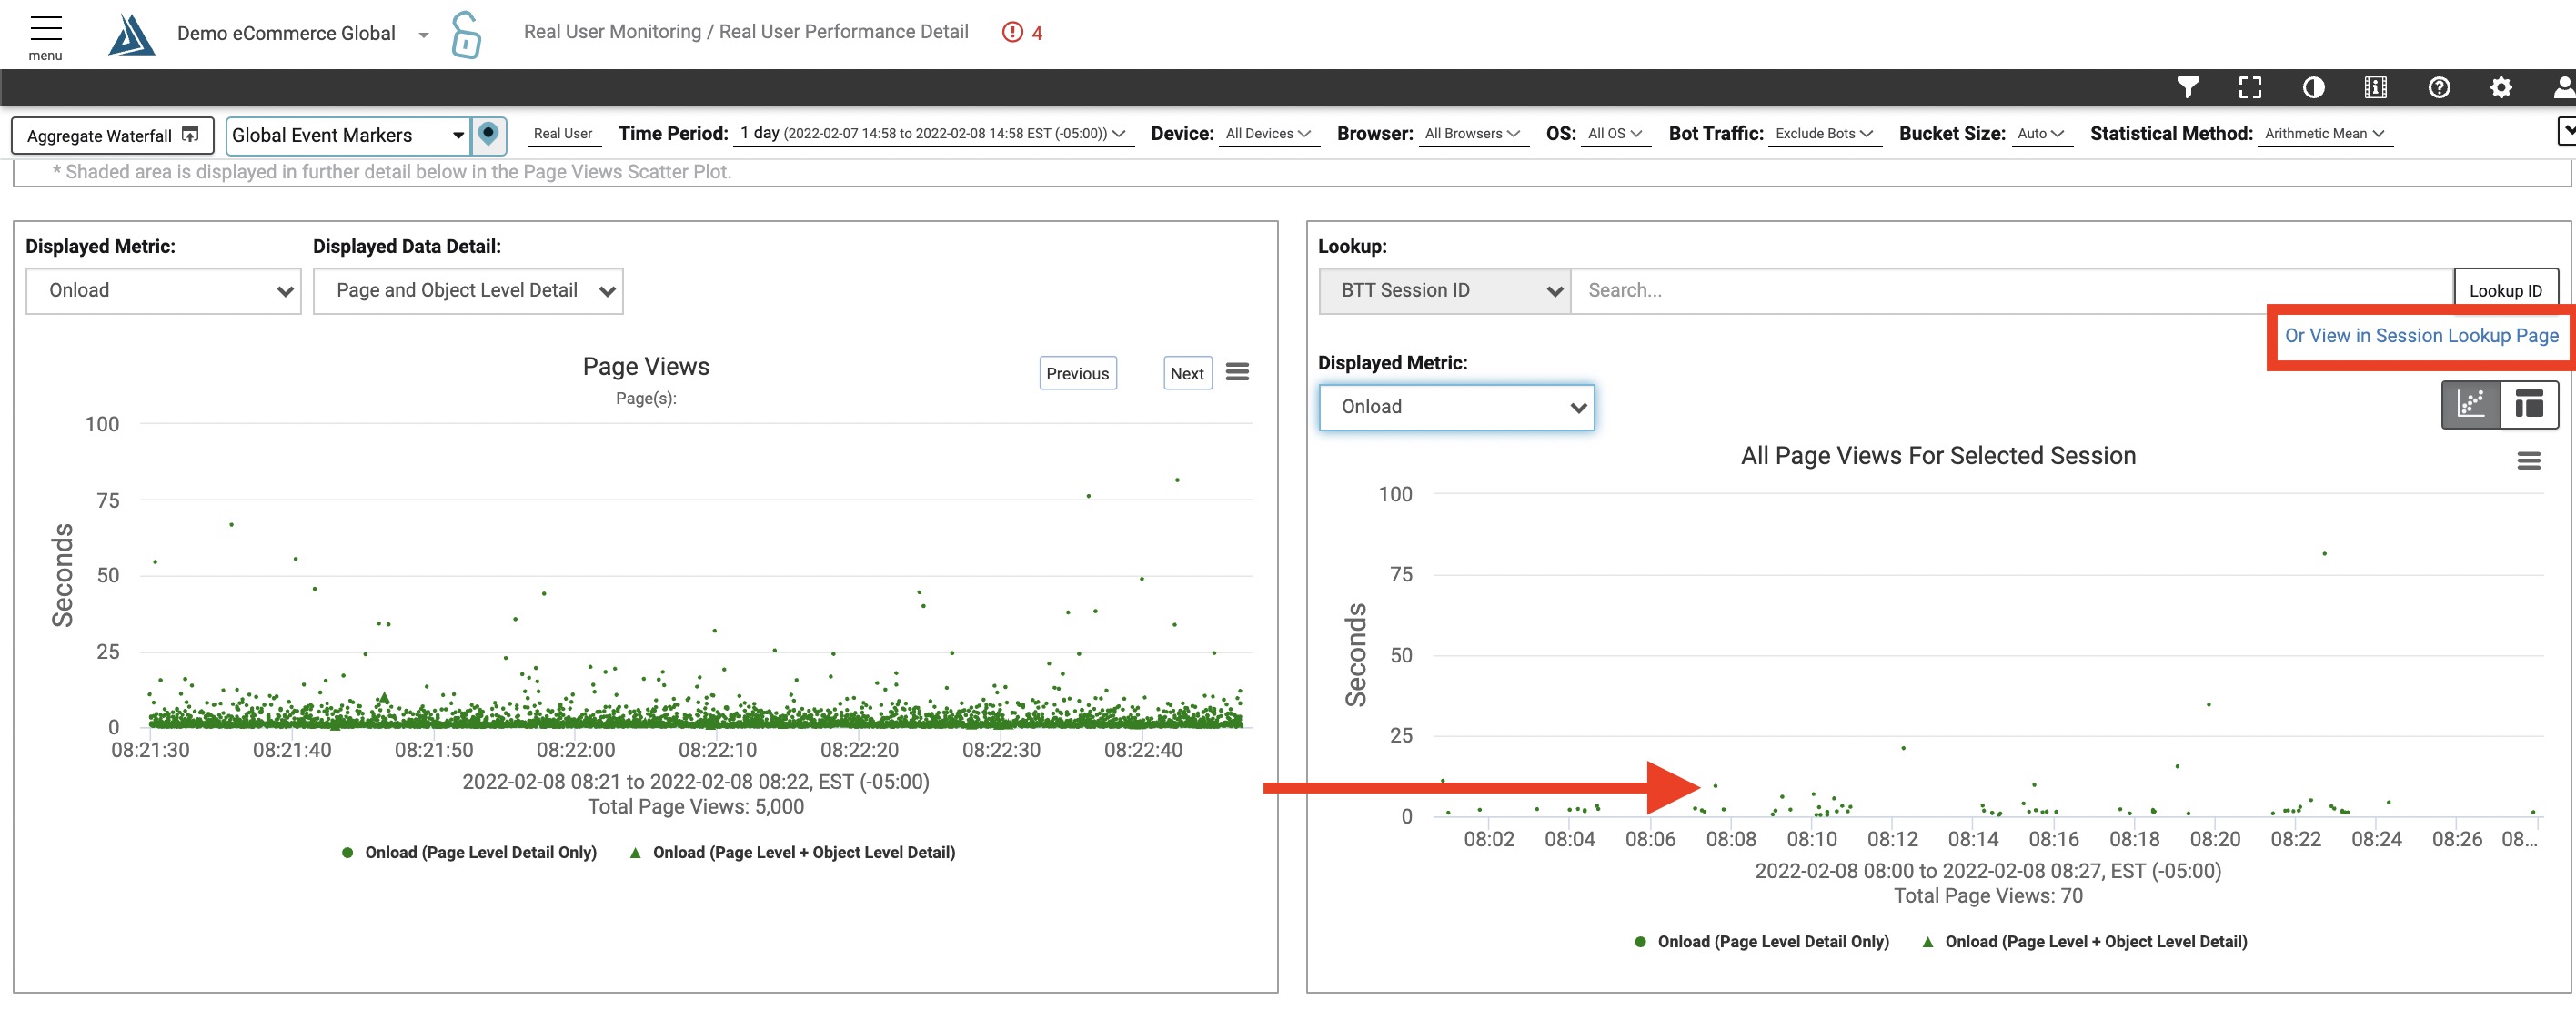
If you select one of the points in either of the scatterplots on this page, it will pull up a table of performance metric details for the selected point. You can also search by BTT Session ID, BTT GUID, IP Address, Customer Session ID, URL, or User Agent String in the lookup widget to view the data for the selected performance metric.
The full functionality of the Session Lookup page is available through the 'Session Lookup Page' link located on the top right of the lookup widget.
Functionality
Session Lookup allows you to search by BTT Session ID, BTT GUID, IP Address, Customer Session ID, URL, or User Agent String to view the matching data for the selected performance metric.
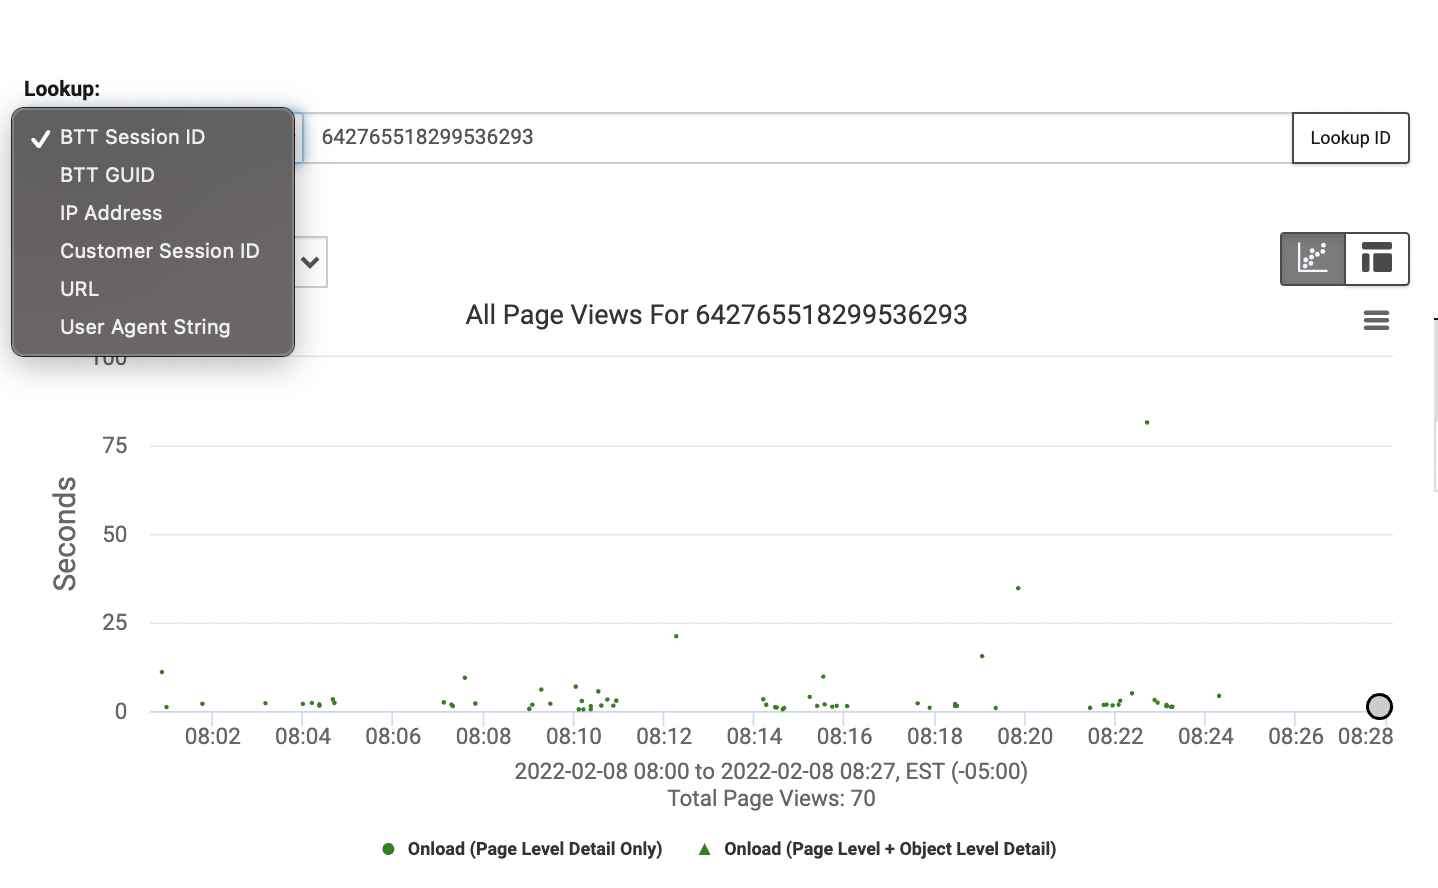
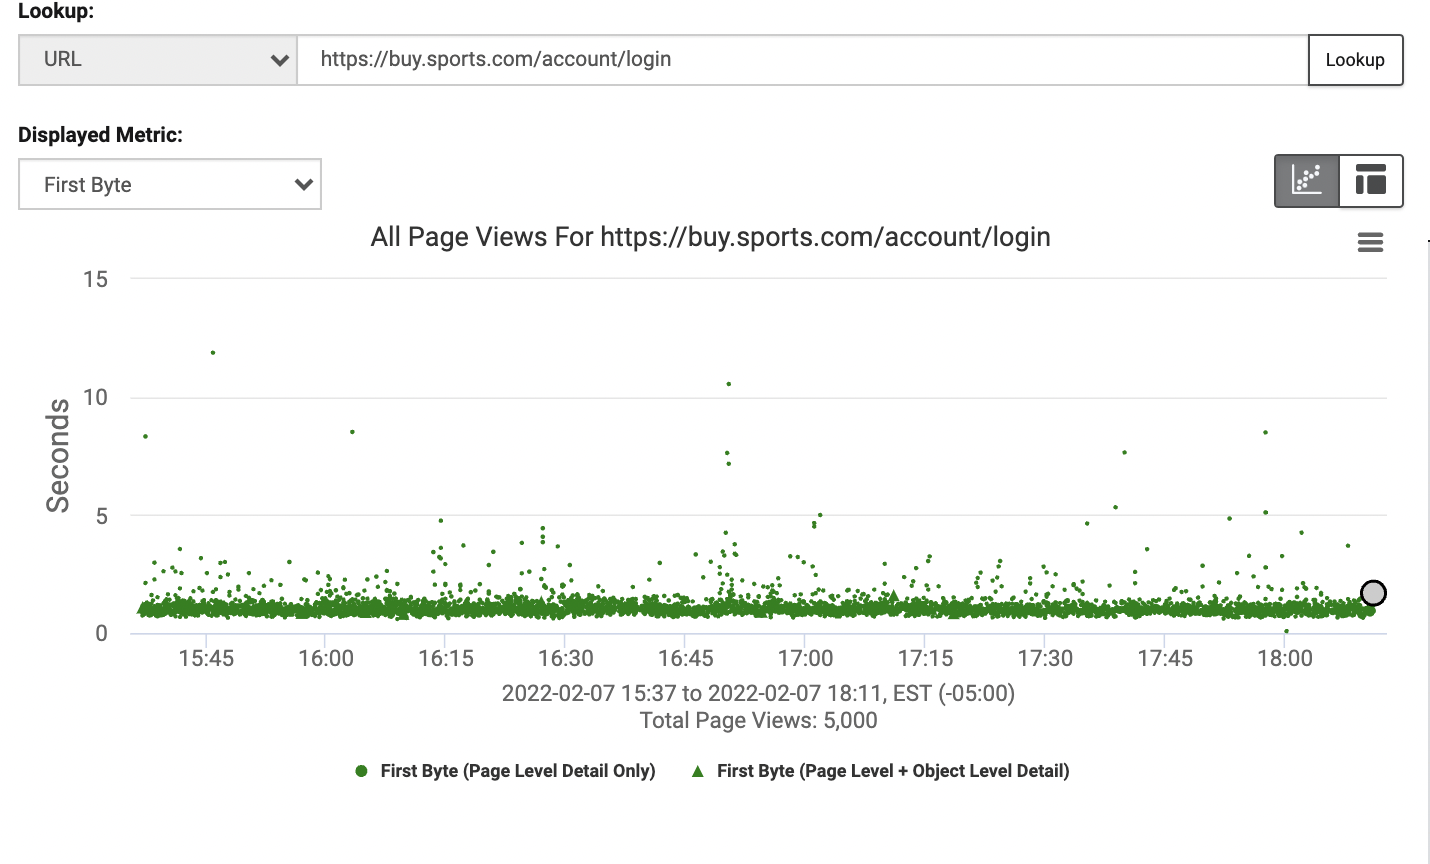
Example All Page Views for selected session:
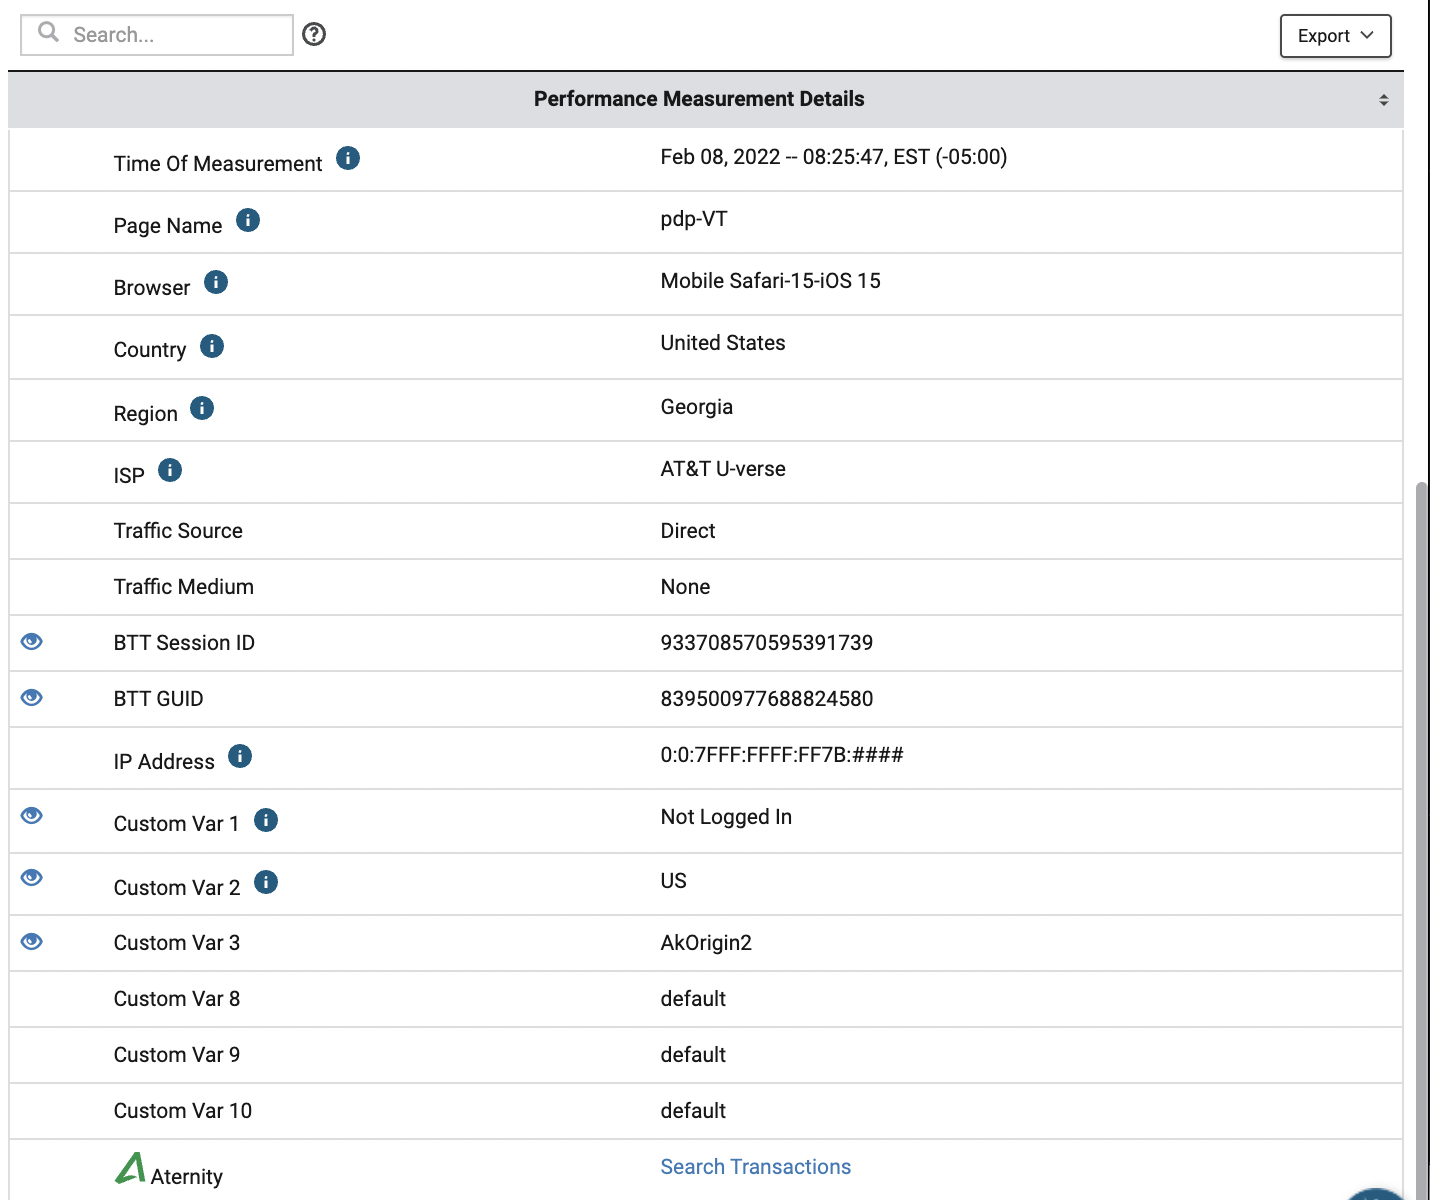
Example Performance Metrics Detail table:
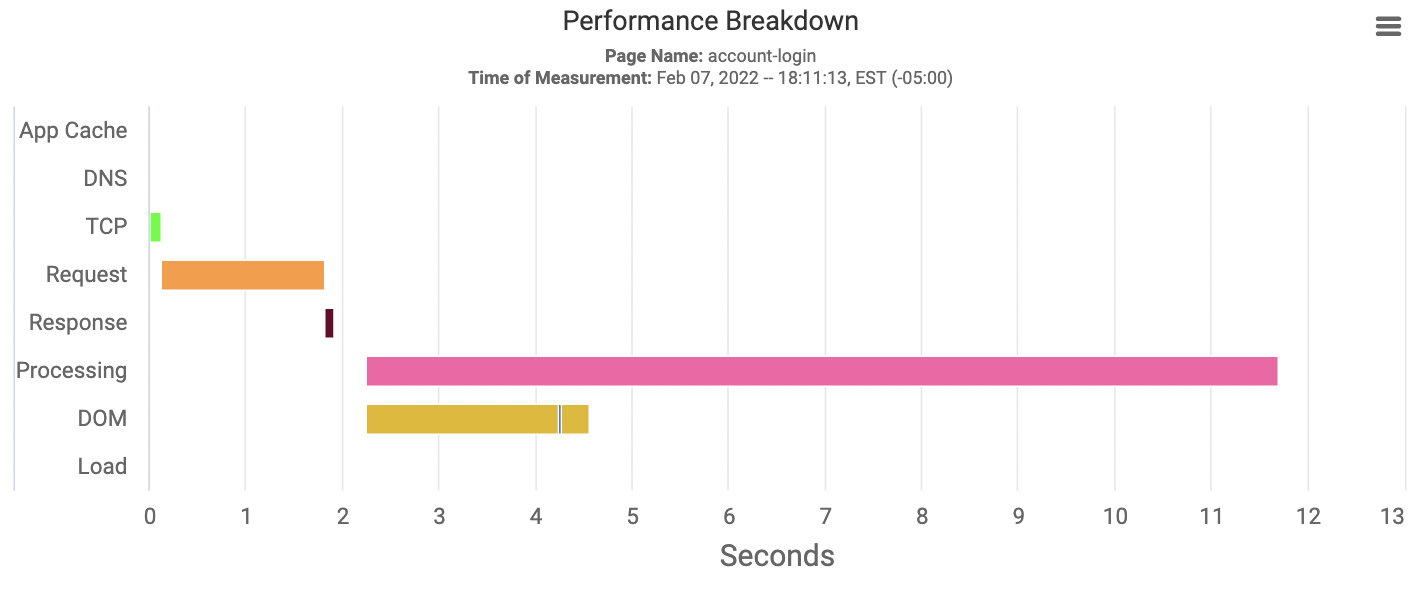
Example Performance Breakdown:
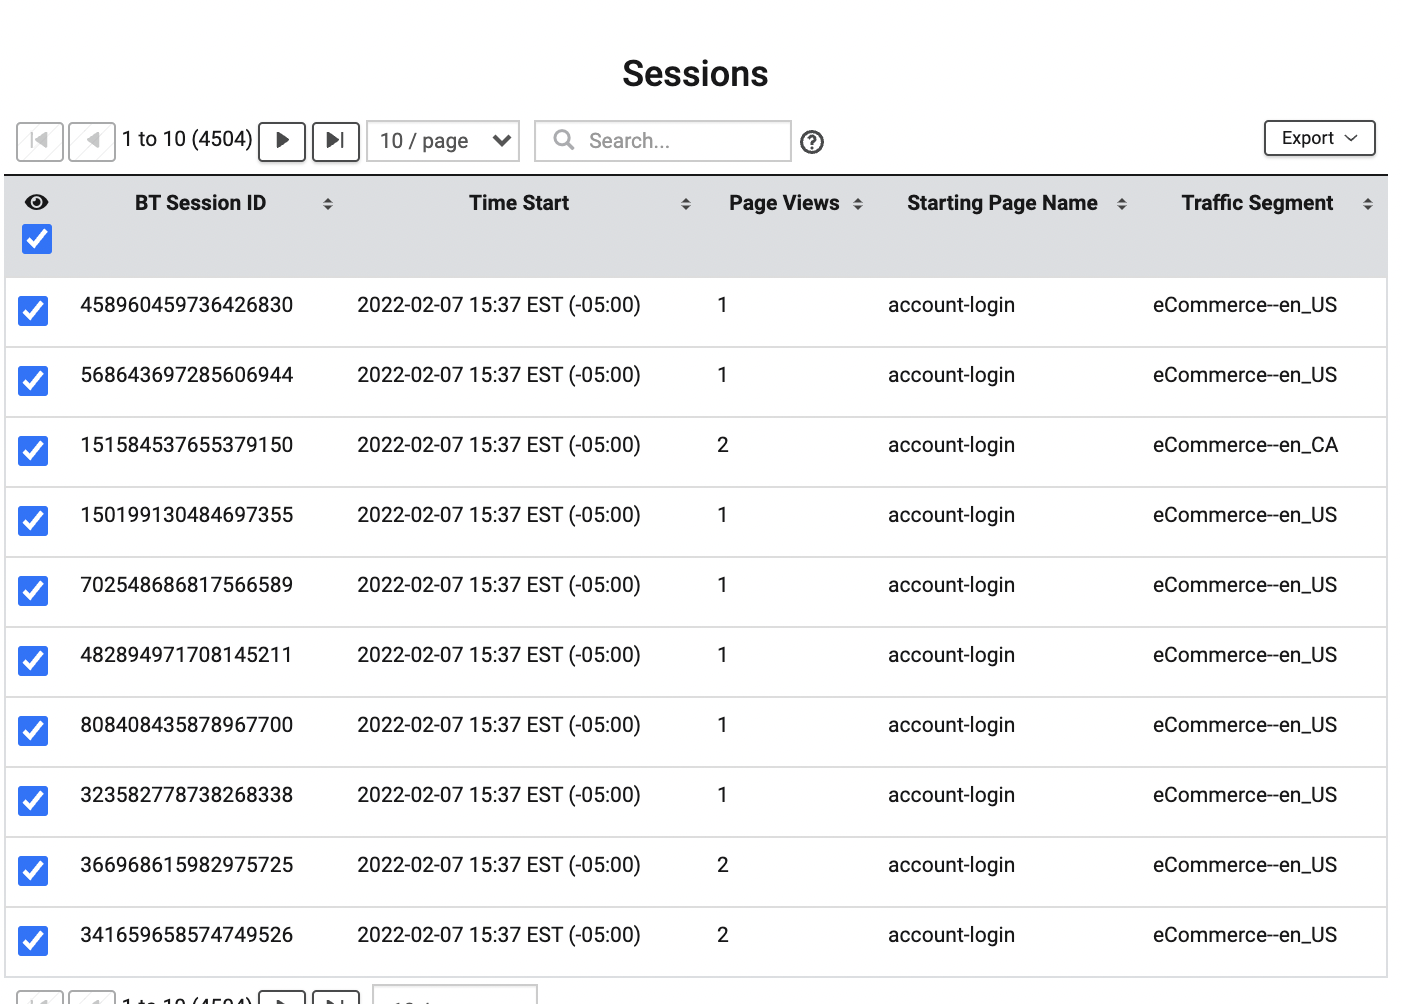
Example Sessions table:
In this table you can toggle which specific session you want to see in your session lookup. It displays the data for Time Start, Page View, Starting Page Name, and Traffic Segment organized by BT Session ID.
