Preview:

Summary:
The Script Performance and Availability Report gives you a detailed breakdown of how your synthetic scripts have been doing over time. First we'll discuss configuring the report, then we'll go into each of the three sections the report contains: Availability, Performance, and Page Content Details.
- Configuring a Script Performance and Availability Report
- Availability section
- Performance section
- Page Content Details section
Configuring a Script Performance and Availability Report
There's no special configuration for this report, so you can simply follow along with the wizard and choose the scripts you would like to appear in the report. Note this report works for single-page measurements as well as multi-page scripts. The single-page measurements will simply have one row where the multi-page scripts will have a row per page/step in the script.
Availability Section

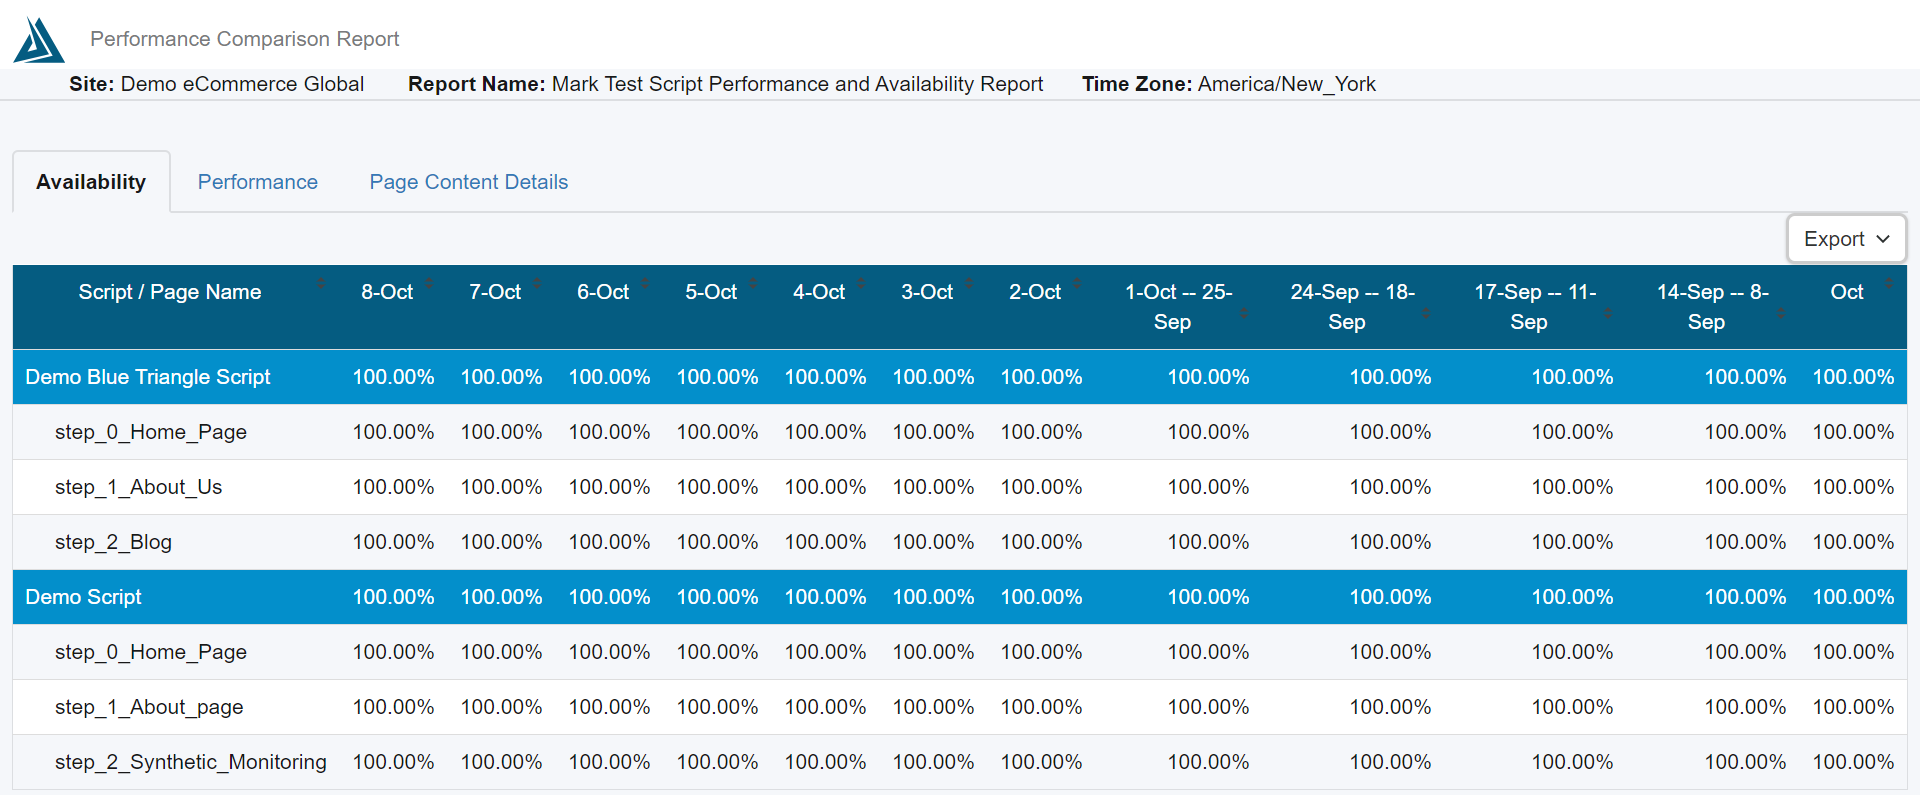
The Availability section lists the percentage availability over each day in the past week, then each week for the 4 weeks prior, and the availability for the current month to date. It provides this information for both the script as a whole and each page. You'll notice the script-level numbers are listed in the blue colored row for clarity. Also, cells between 96-98% will be colored orange, and those below 96% will appear red.
Performance Section

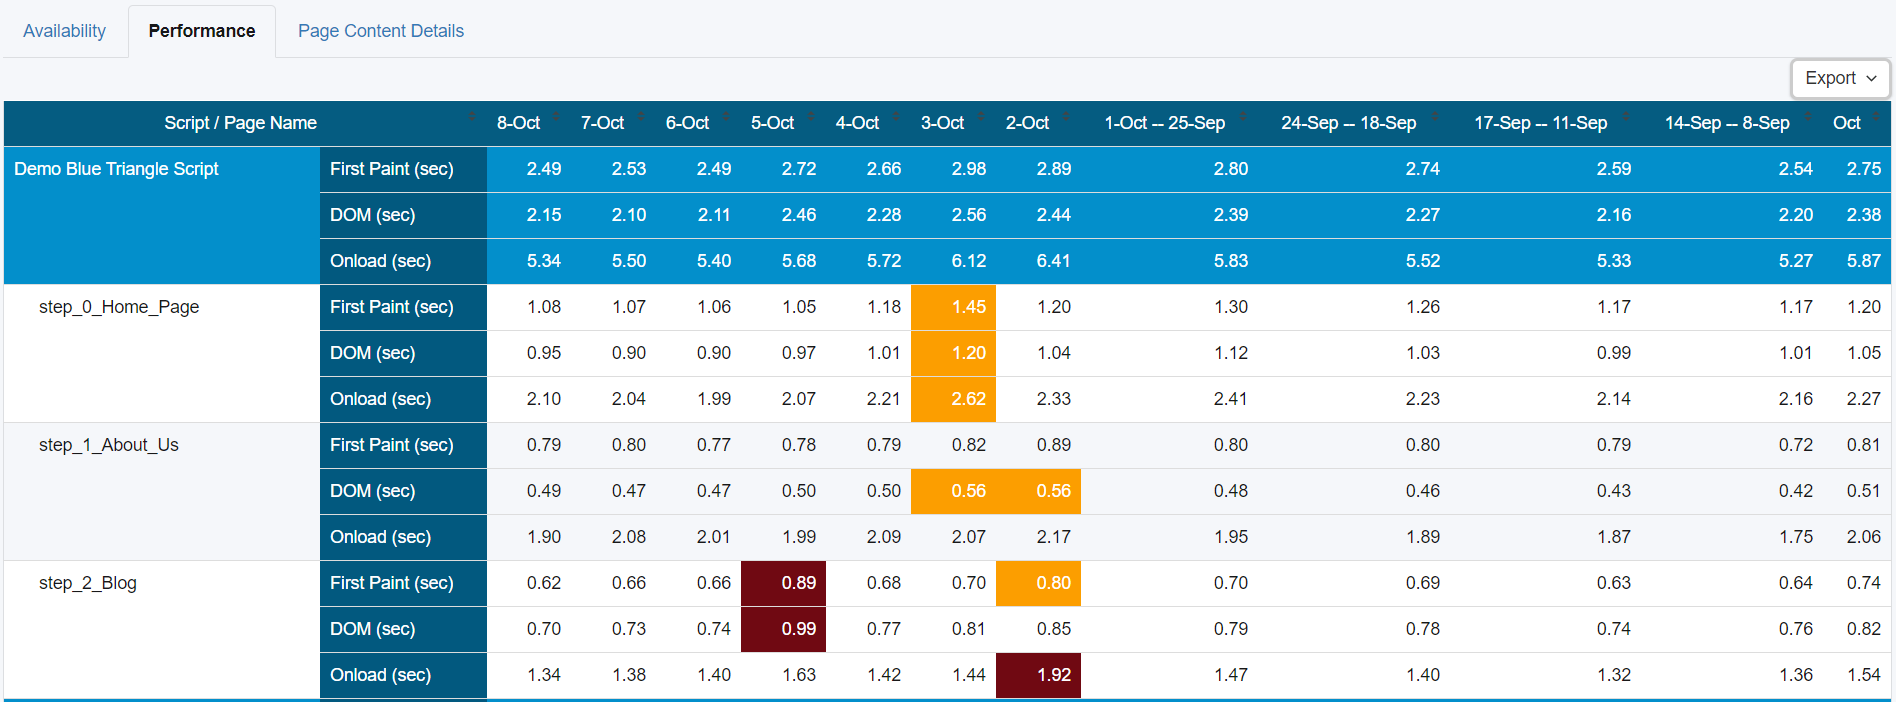
The Performance section provides the same format and columns as the availability section, but here you'll get performance timings for the script in total and for each page in the script. For each row you'll see First Paint, DOM and Onload time in seconds. Again you'll notice the script-level numbers are listed in the blue colored row for clarity. Also, cells 15%-25% slower than the average for the past 4 weeks will be colored orange, and cells 25% slower will appear as red.
Page Content Details Section

The Page Content Details section provides the same format and columns as the availability and performance sections, but here you'll get page content information for the script in total and for each page in the script. For each row you'll see Page Size (MB) and Element Count. Also, just like the other sections you'll notice the script-level numbers are listed in the blue colored row for clarity. Lastly, cells 15%-25% slower than the average for the past 4 weeks will be colored orange, and cells 25% slower will appear as red.