Preview:

Summary:
The Conversions Over Time Report shows you the conversion rate, average order value and performance over time.
Configuring a Conversions Over Time Report
To configure a Conversions Over Time Report, follow along with the configuration wizard and be sure to choose your Performance Metric and any Filters you wish to apply to the data.
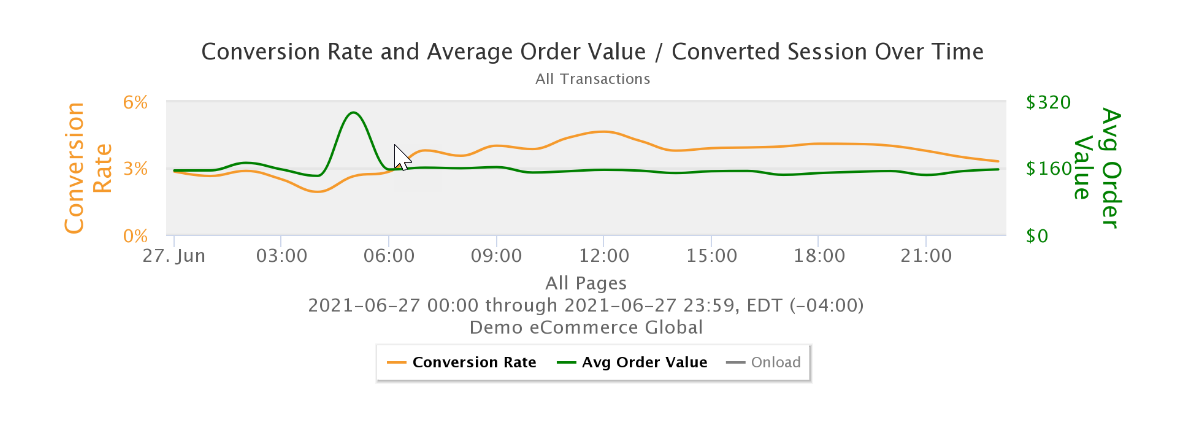
The Performance Metric you choose will be an additional line in the graph. For example, notice in the image above the 3 lines in the legend are average order value, conversion rate and Onload - the Onload metric was selected in in the configuration in this example.
As always you can use the Filters to slice and dice the data anyway you like. You can filter by traffic segment, device, country, region and more.
How to Analyze the Conversions Over Time Report
The Conversions Over Time Report allows you to see how average order value and conversion rate are affected due to performance.
The graph at the top shows you the details in a line graph over time. You can toggle the legend items to hide and show them in the graph.
For context, see the time period listed in the graph subtitle above the legend, and below the graph to the left you can find the selected filter options - including site, traffic segment and more.
The table at the bottom of the page shows you the data in the graph in a tabular view. You can see the numbers for conversion rate and average order value per converted session for each hour in the report look-back period.
