Table of Contents
Overview
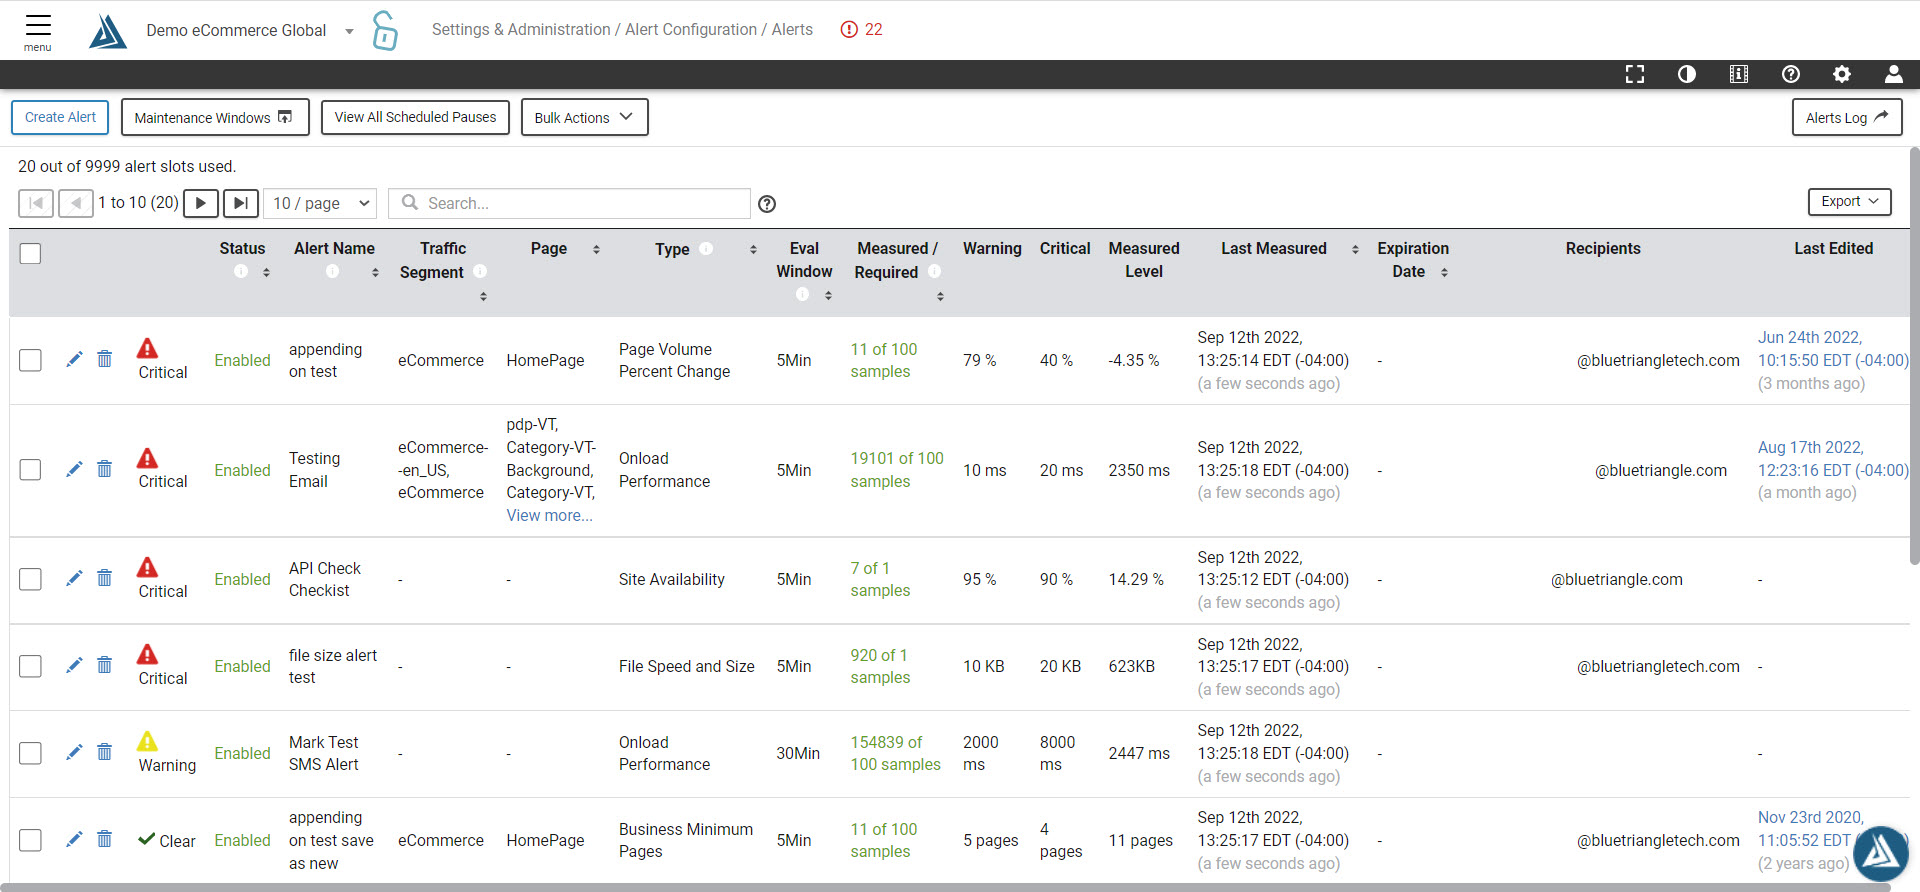
The Alerts page allows you to schedule notifications to be sent whenever a site metric meets specified conditions. These alerts can be sent to multiple recipients through email or Slack, and they can be customized with graphs and custom text.
Please note, alerts are only available for numeric Custom Variables.
How to Find Your Alerts
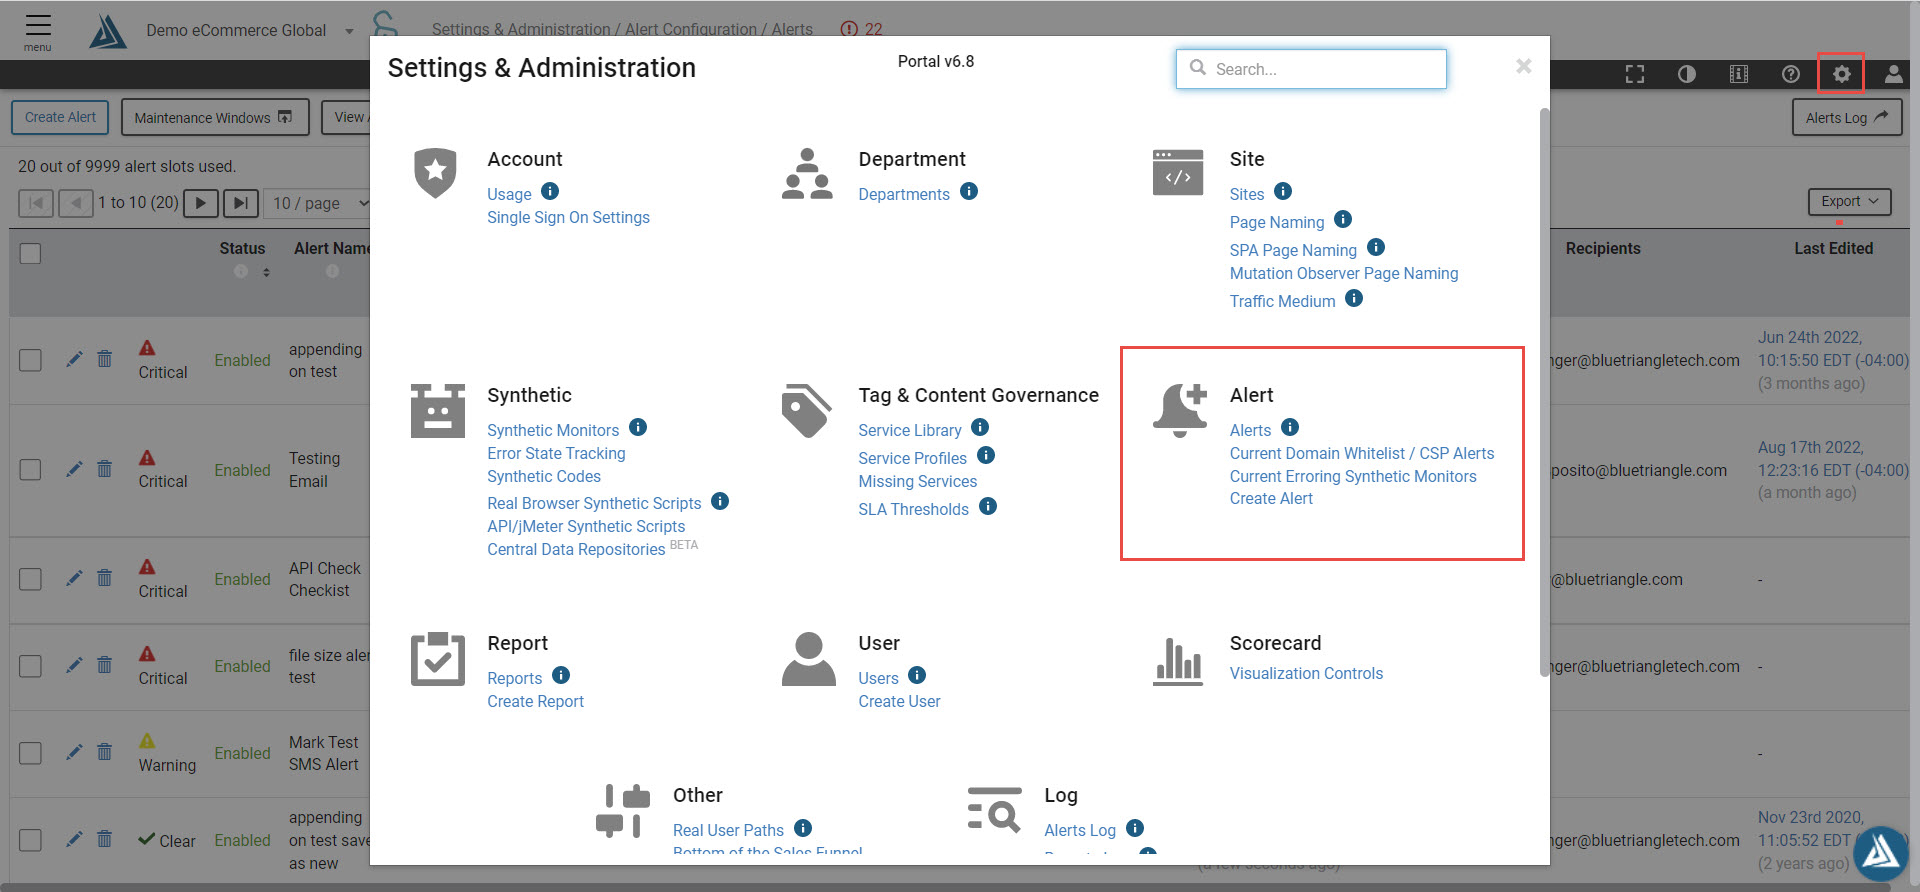
Alerts are available in two places in the Blue Triangle Portal. Open your Settings & Administration menu, indicated by the gear icon in the top right of the portal, and there is a link to the Alerts page.
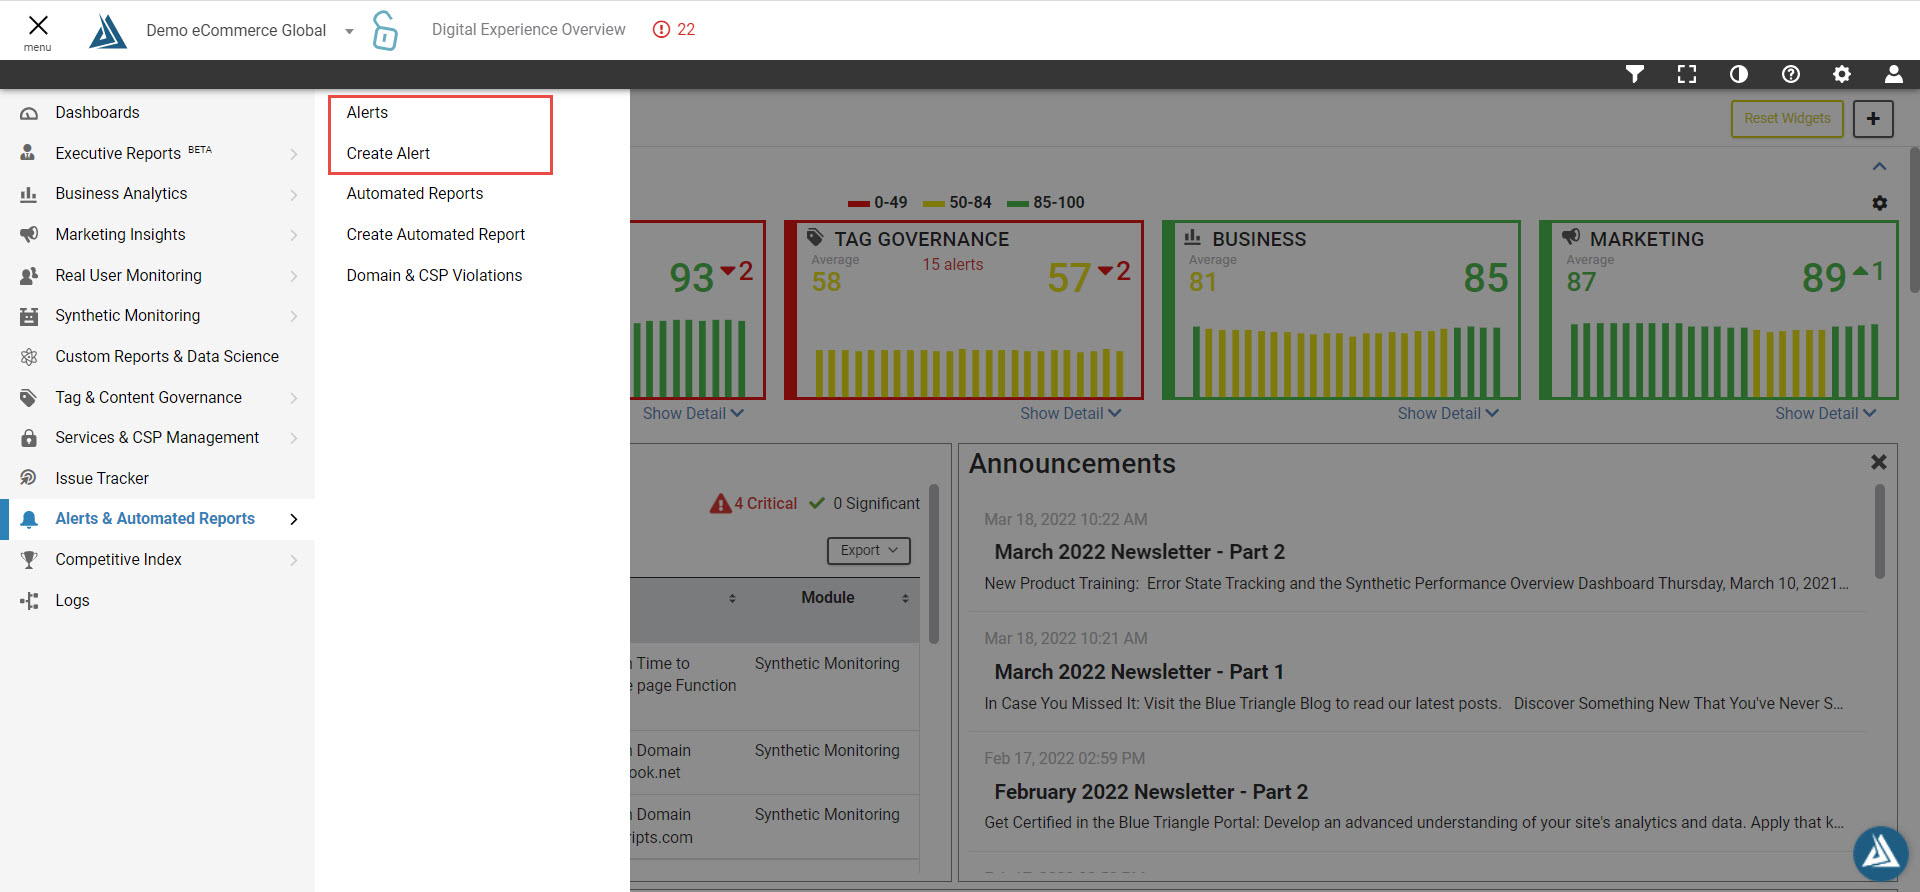
Alternatively, in the left side navigation menu, under Alerts & Automated Reports, you are able to select the Alerts link to view preexisting alerts or Create Alert to configure a new alert.
How to Create and Edit an Alert
To set up a new alert, click the Create Alert button. To edit an existing alert, select the pencil icon next to the alert you wish to reconfigure. To delete an existing alert, use the trash can icon next to the alert you wish to delete.

Both selecting Create Alert or editing an existing alert will open the Alert configuration menu. For this example, we will be creating a new alert.
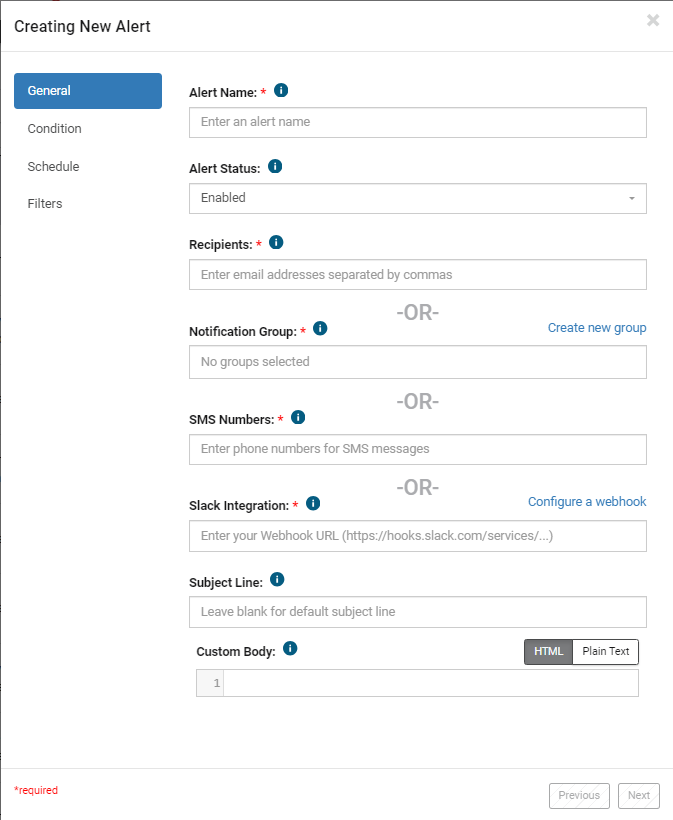 |
- Enter an Alert Name and select an Alert Status.
- You must specify either a list of Recipients or a Notification Group or both.
- Click “Create new group” to create a new Notification Group to send alerts to.
- If you want to send alerts through Slack, enter a web hook URL for the Slack Integration. Click “Configure a webhook” to retrieve the URL.
- Select whether you would like to include a graph in the alert, and optionally, enter a custom Subject Line and/or Custom Body.
- Verify that information is correct, and click Next.
|
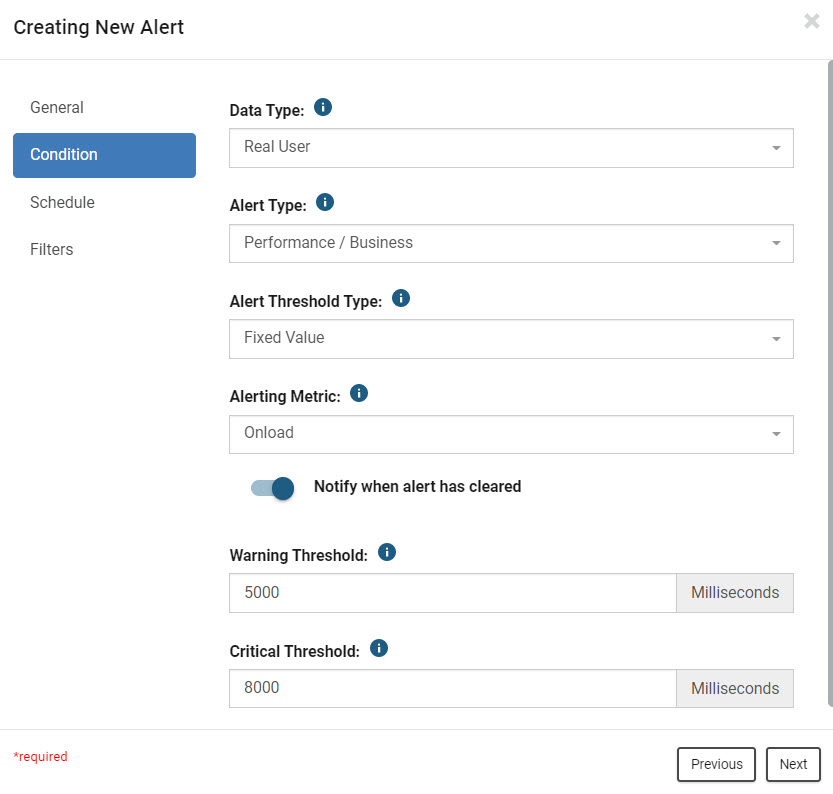 |
- In the Condition tab, select either “Real User”, “Synthetic”, or “API/Base Page & SSL” for the Data Type.
- For the Alert Type, select “Performance/Business” if the data type is “Real User”. Select “Performance” if the data type is “Synthetic” or “API/Base Page & SSL”.
- Select “Fixed Value", “Percent Change”, or “Standard Deviation” for the Alert Threshold Type. Changing this will affect the units of the Warning and Critical Thresholds.
- Selecting “Percent Change” or “Standard Deviation” will add both Positive and Negative Thresholds that represent Upward and Downward Limits, respectively.
- You are able to select your preferred Alerting Metric next, options will vary depending on the selected data type. If the alert threshold type is “Fixed Value”, enter values based on the units for the Warning Threshold and Critical Threshold.
- For all other alert threshold types, enter values based on the units for the Positive Warning/Critical Thresholds and Negative Warning/Critical Thresholds. Verify that information is correct, and click Next.
|
 |
-
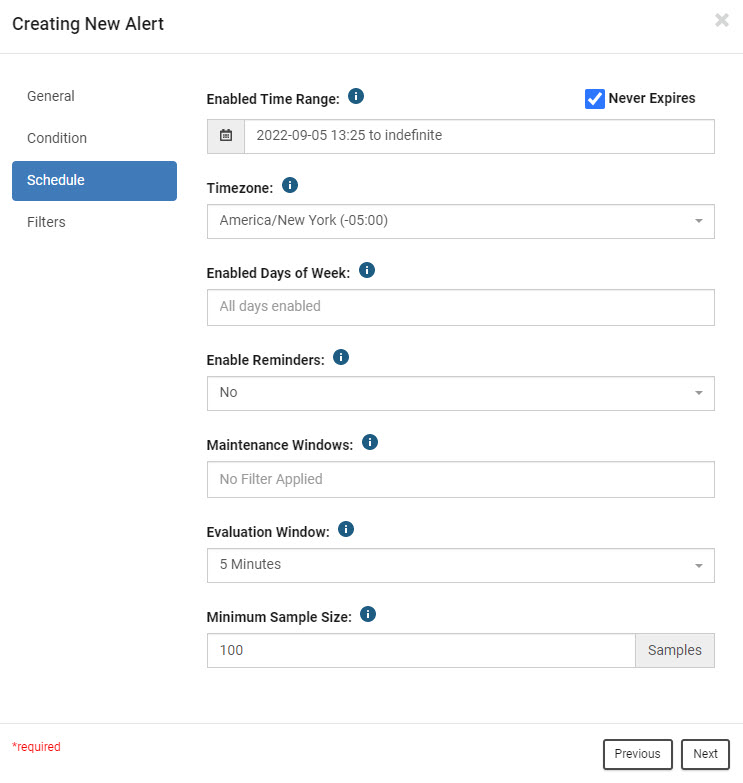
Specify an Enabled Time Range for when the alert should run. If this is an ongoing alert, check the Never Expires box and select a single date. If this alert should expire, uncheck the Never Expires box and select a range of dates.
-
Select the Timezone, Enabled Days of Week, Maintenance Windows, and the Evaluation Window.
-
Verify that information is correct, and click Next.
|
 |
-
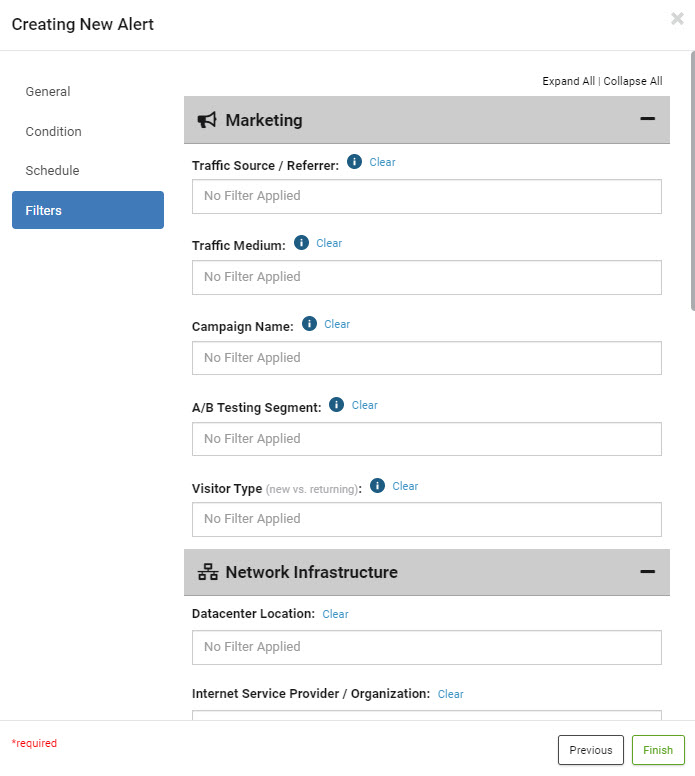
Select any filters you would like to apply.
-
When you are finished editing your alert configuration, select Finish.
|
Managing Alerts
At the top of the Alerts page there are a few different buttons that can help you manage your alerts.

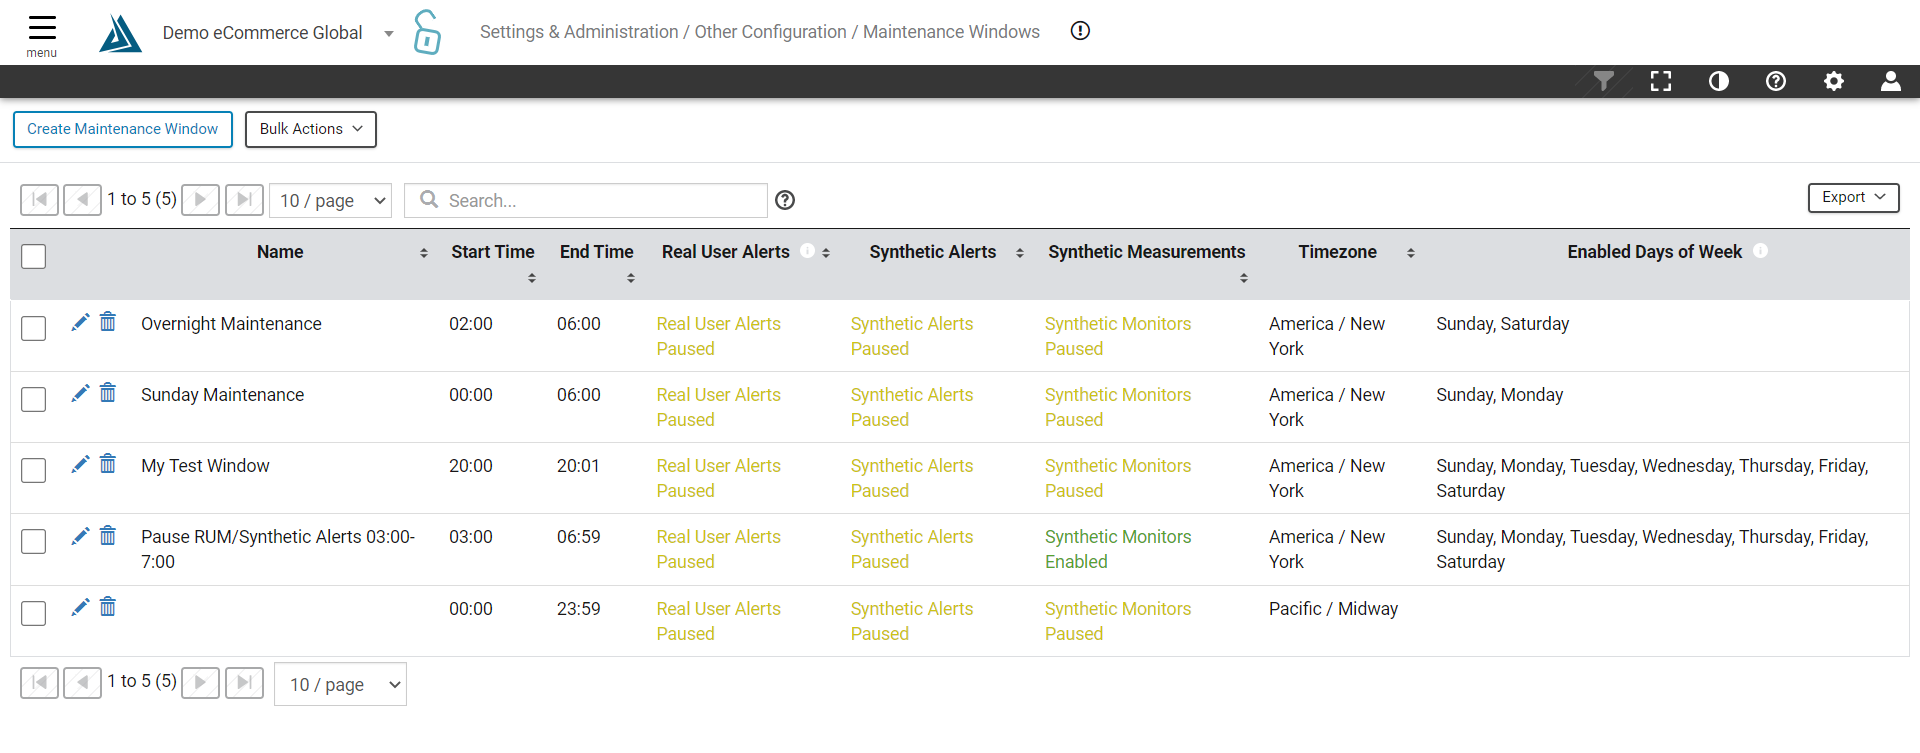
The Maintenance Window button gives you the ability to mute alerts during specific time periods. See this article for more information.
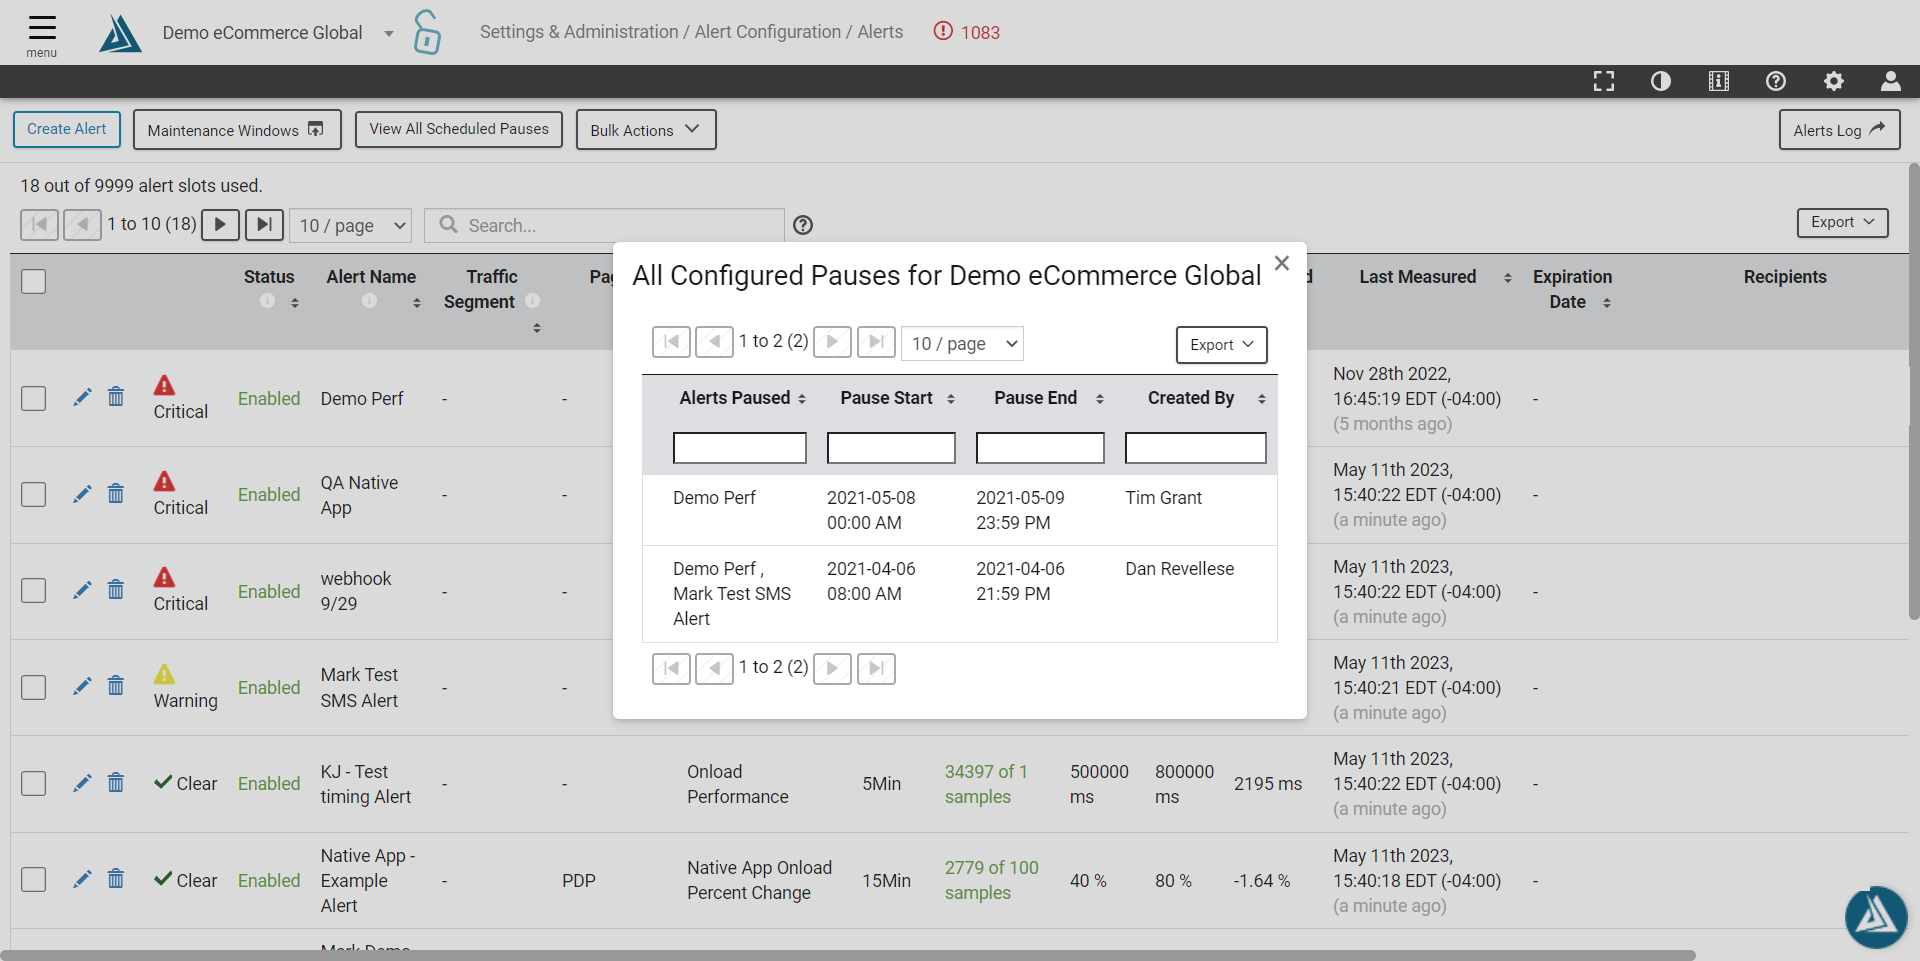
See any upcoming alert pauses under View All Scheduled Pauses.
Bulk Actions enables for the editing of multiple alerts at once, like Pausing, Disabling, and creating Maintenance Windows.

Alerts Log
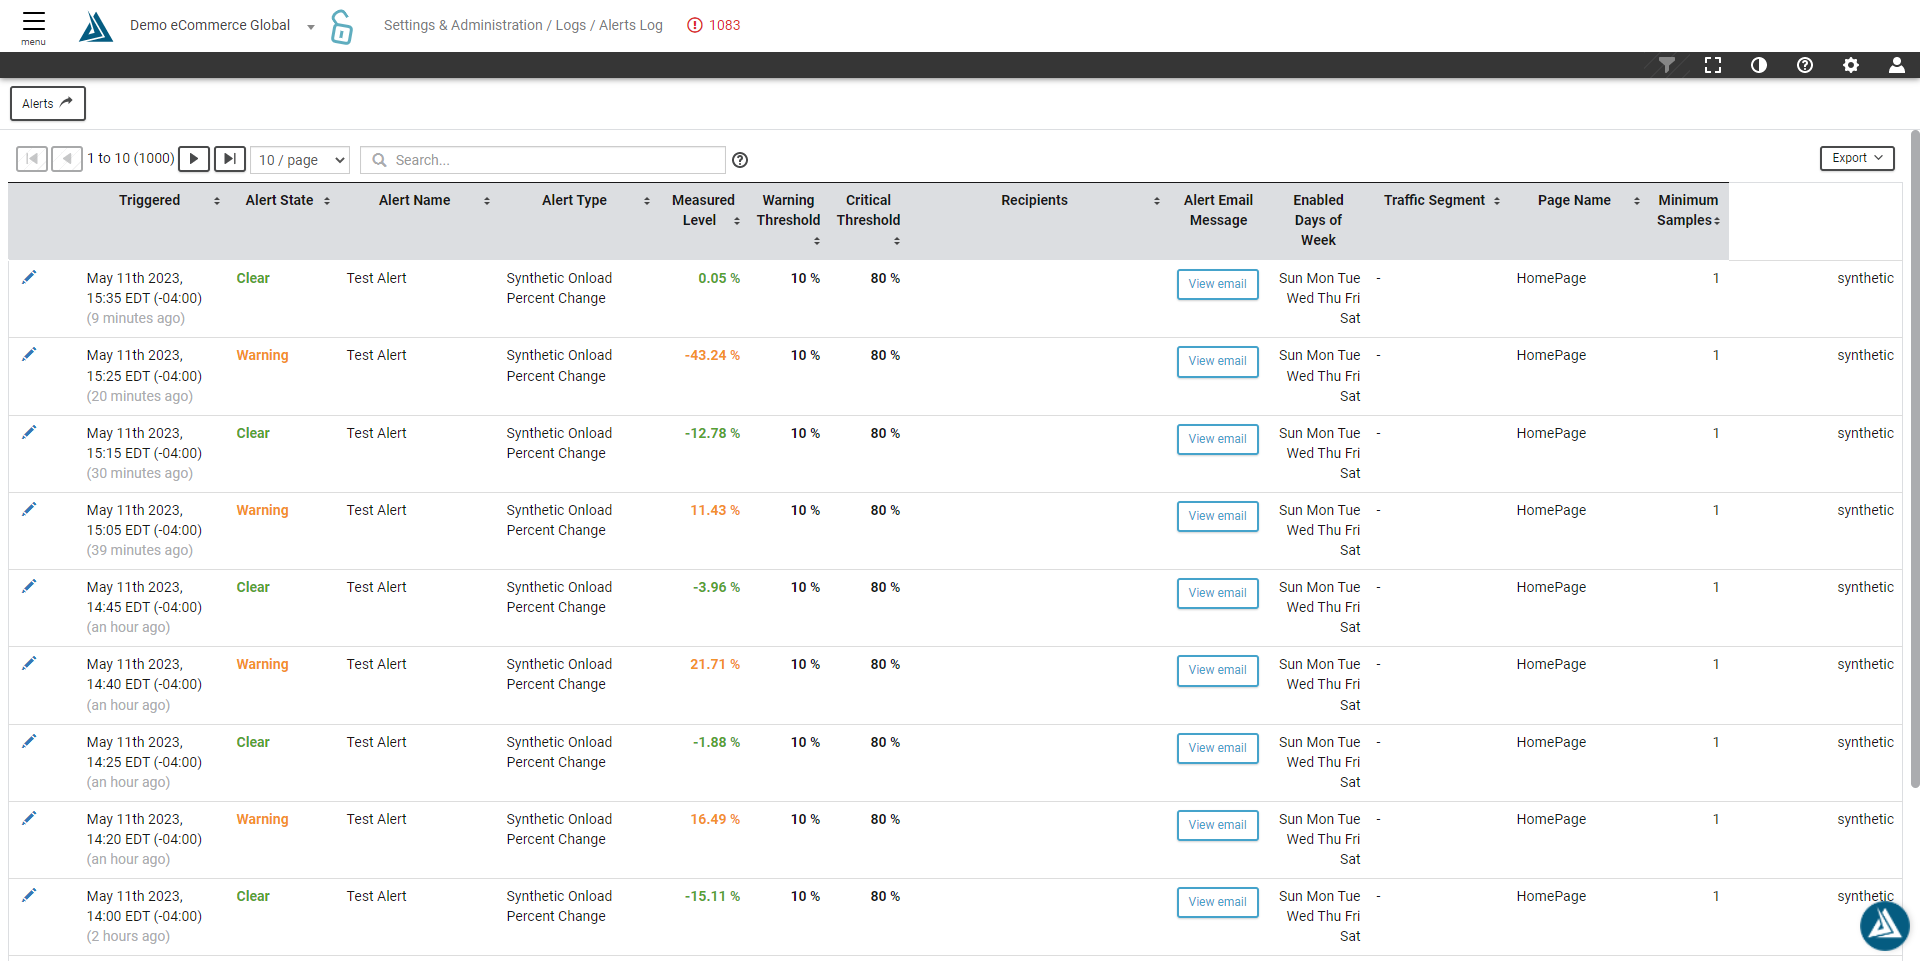
Lastly, the Alerts Log page gives an overview of alert states along with keeping a log of emails sent about alerts.

