Table of Contents
- Overview
- How to Find the Synthetic Site Health Dashboard
- Widgets
- How to Filter the Synthetic Site Health Dashboard
Overview
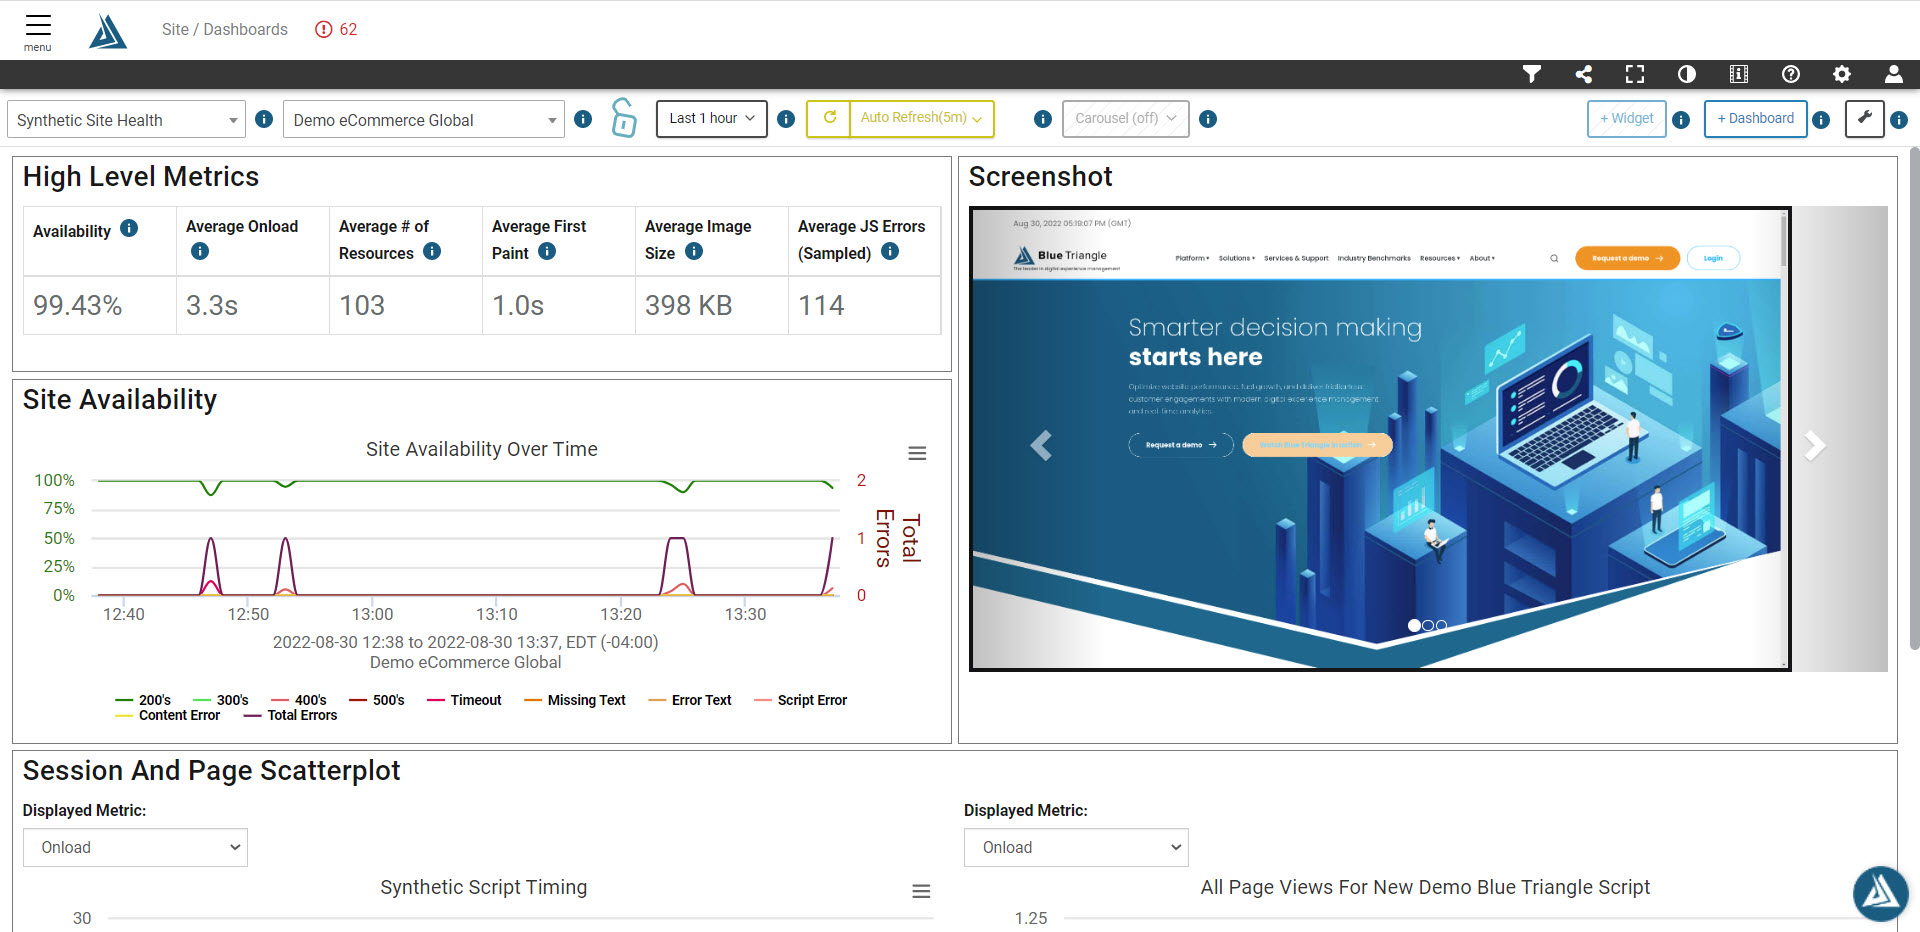
The Synthetic Site Health preconfigured dashboard provides you with insight into the availability of your site / app and high-level metrics, as well as drill down capabilities into scripting errors. At the top of the page you are able to customize the time period you would like to analyze.
How to Find the Synthetic Site Health Dashboard
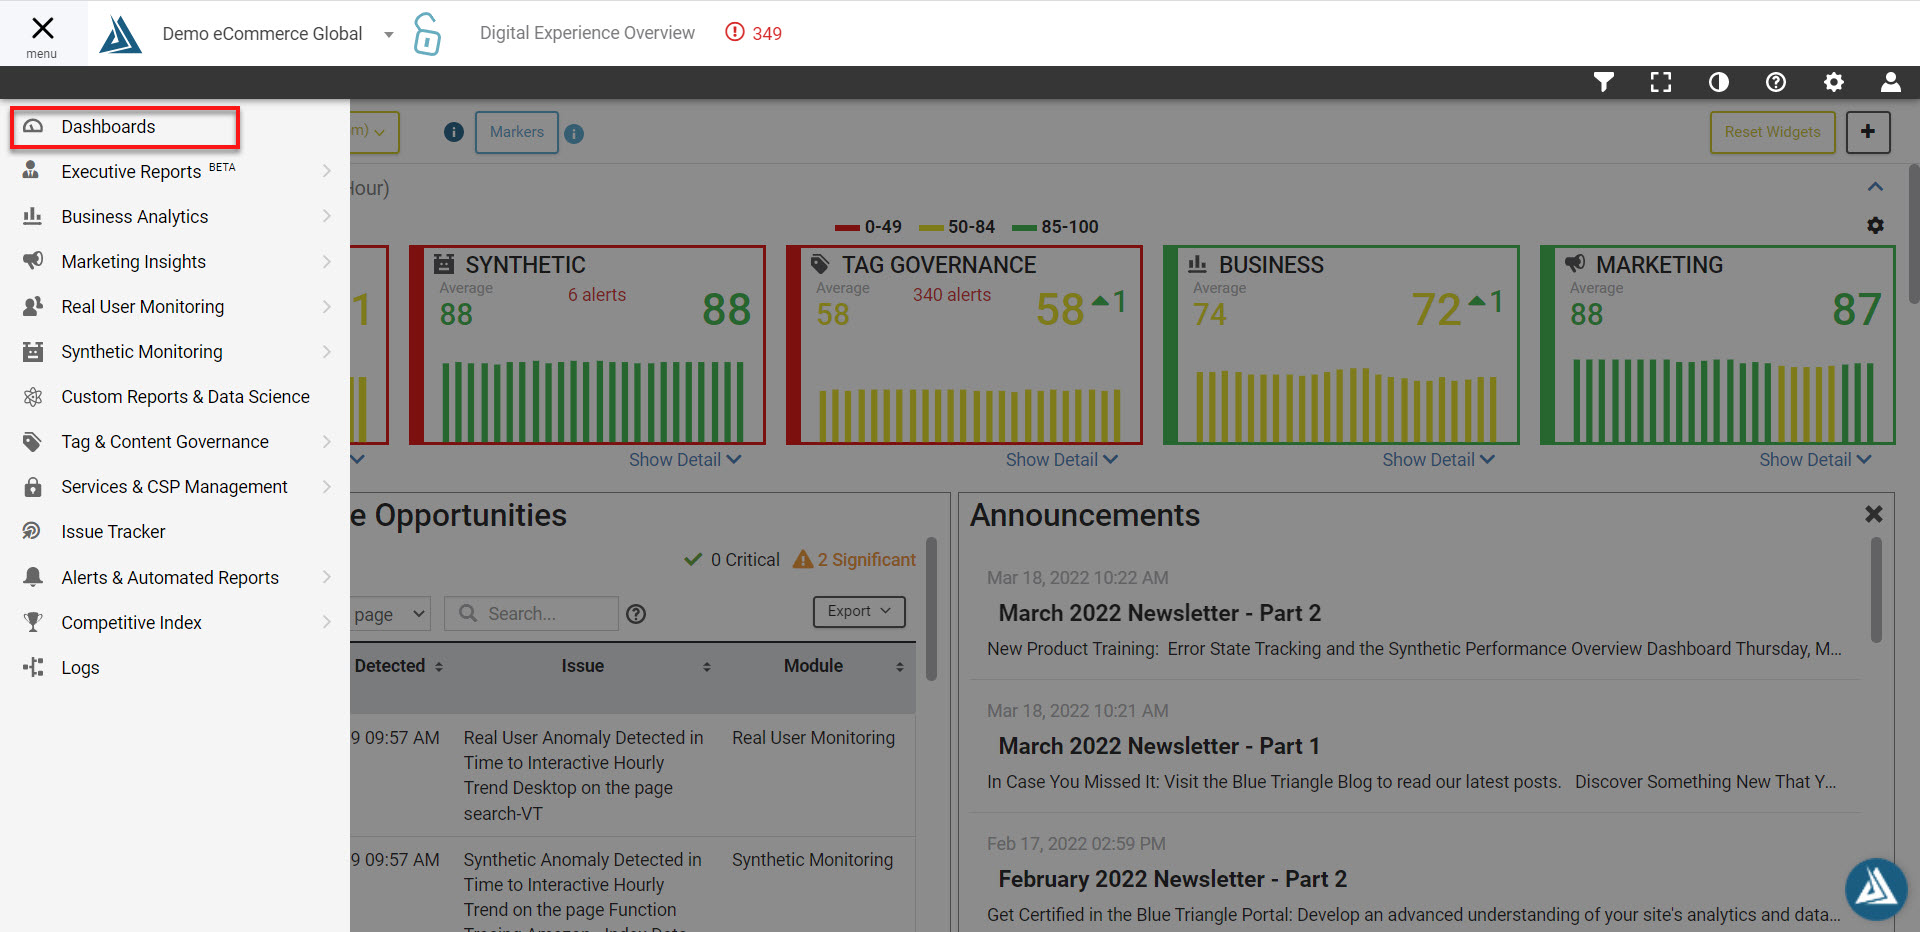
To find the Synthetic Site Health dashboard, first click the menu on the top left hand side of the BT Portal, and go to Dashboards.
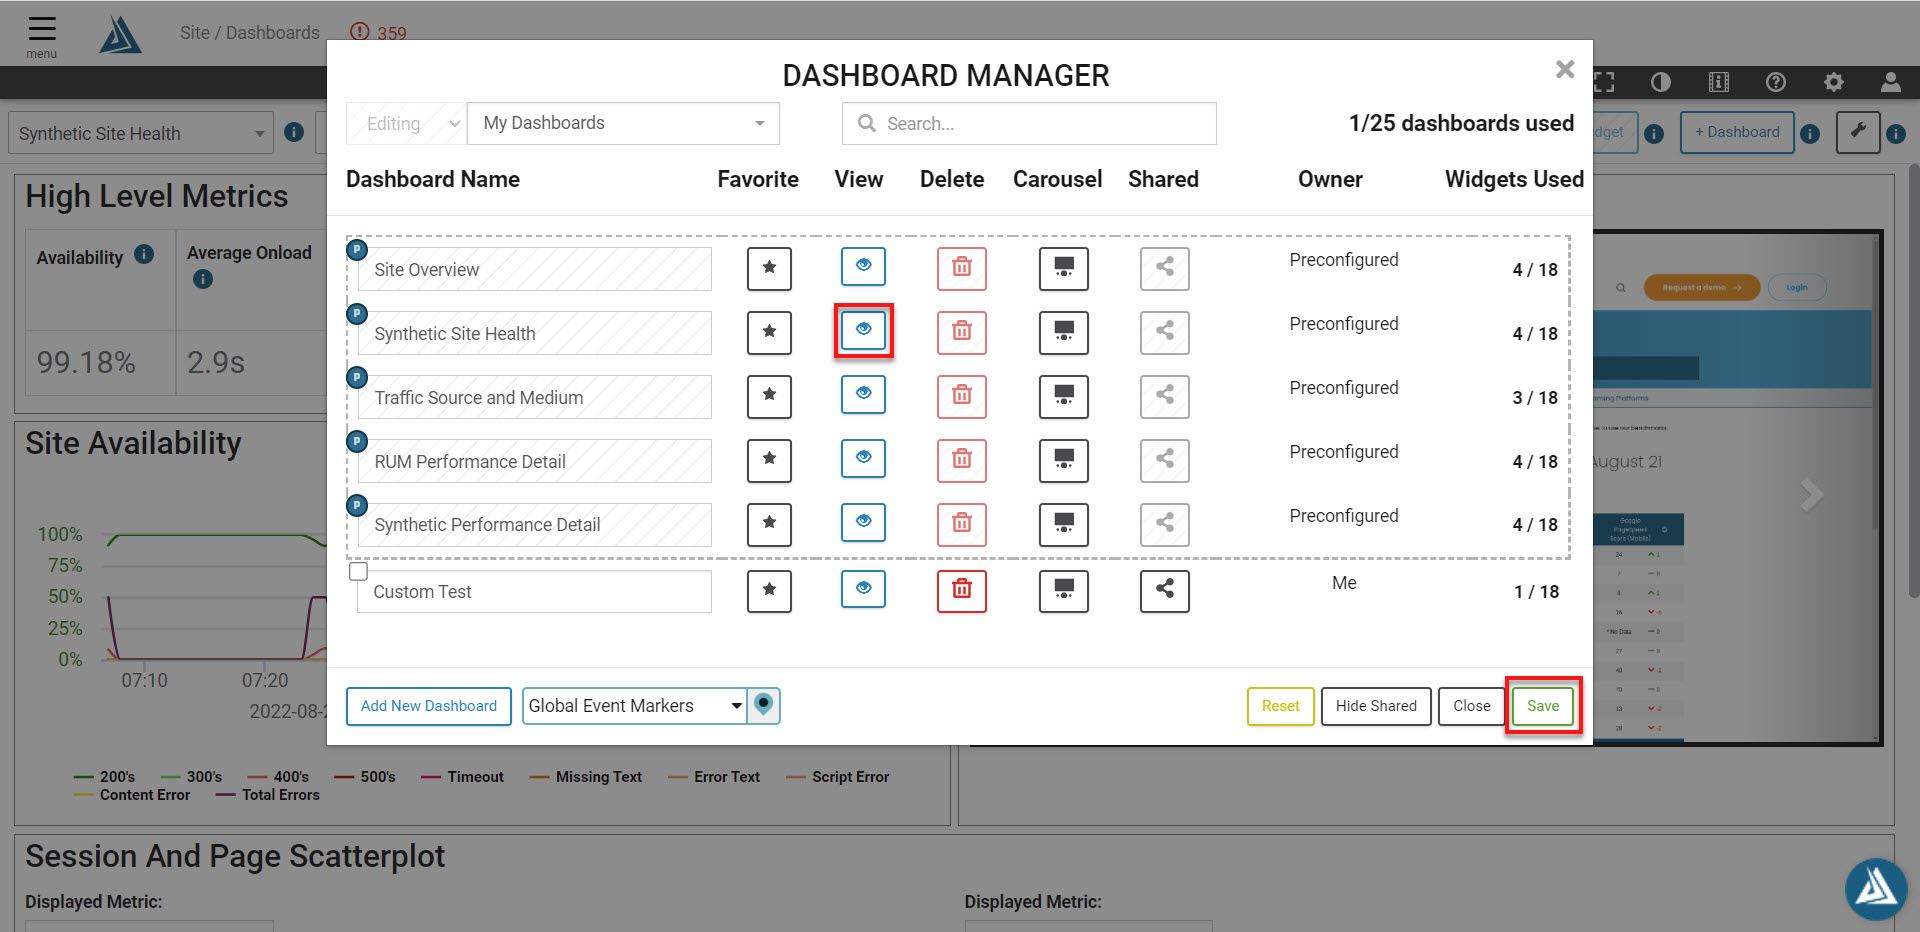
Once in the Dashboards page, click the drop down menu on the top left of the page and click on Synthetic Site Health from the preconfigured dashboards.

Alternatively, clicking on the gear icon at the top right side of the page will open the Dashboard Manager, where you can click on the eye icon to view a certain dashboard.
Widgets
High Level Metrics
The two widgets in the top left provide an overview of key metrics for your site / app along with its availability and number of errors. This widget provides an overview of key metrics for a site.

Site Availability
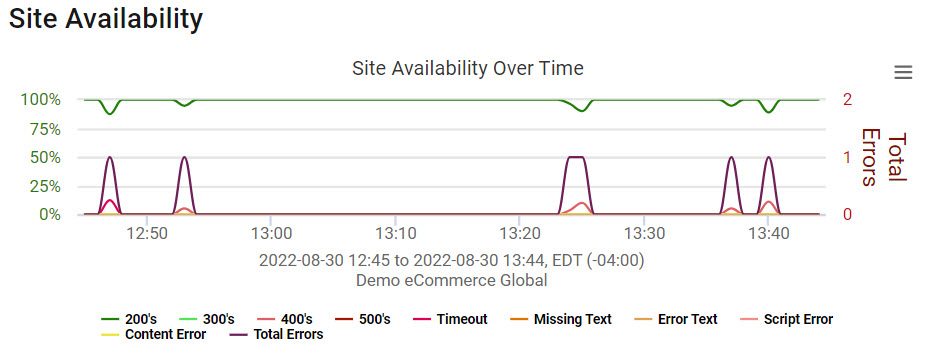
This widget gives a visual representation of the site availability and number of errors. You are able to select which lines that are displayed in this graph by clicking the corresponding error type in the legend.
Screenshot
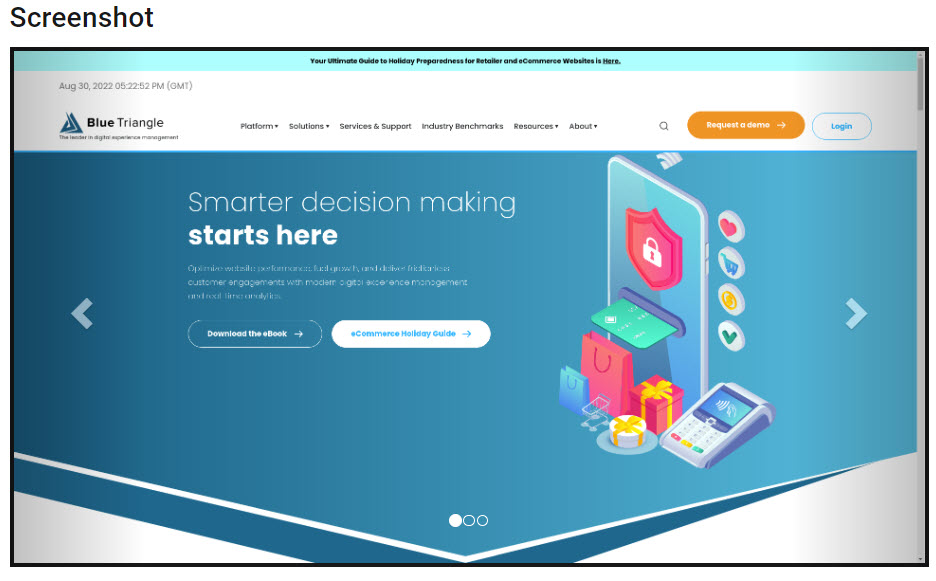
The Screenshot widget provides a screenshot from one of the synthetic measurements in the selected time period. To view data for a specific monitor, select a monitor name in the right side filtering menu.
Session and Page Scatterplot
The bottom widget shows the synthetic script timings. Square points indicate the measurement includes a screenshot, diamond represents a measurement with both a screenshot and a filmstrip, and triangle points will only include data from the measurement. By clicking a scatter plot point on the left you are able to drill down into the individual pages for the script on the right. Clicking a scatter plot point on the right opens a new table below with more information including the object level detail waterfall, HAR file and film strip.
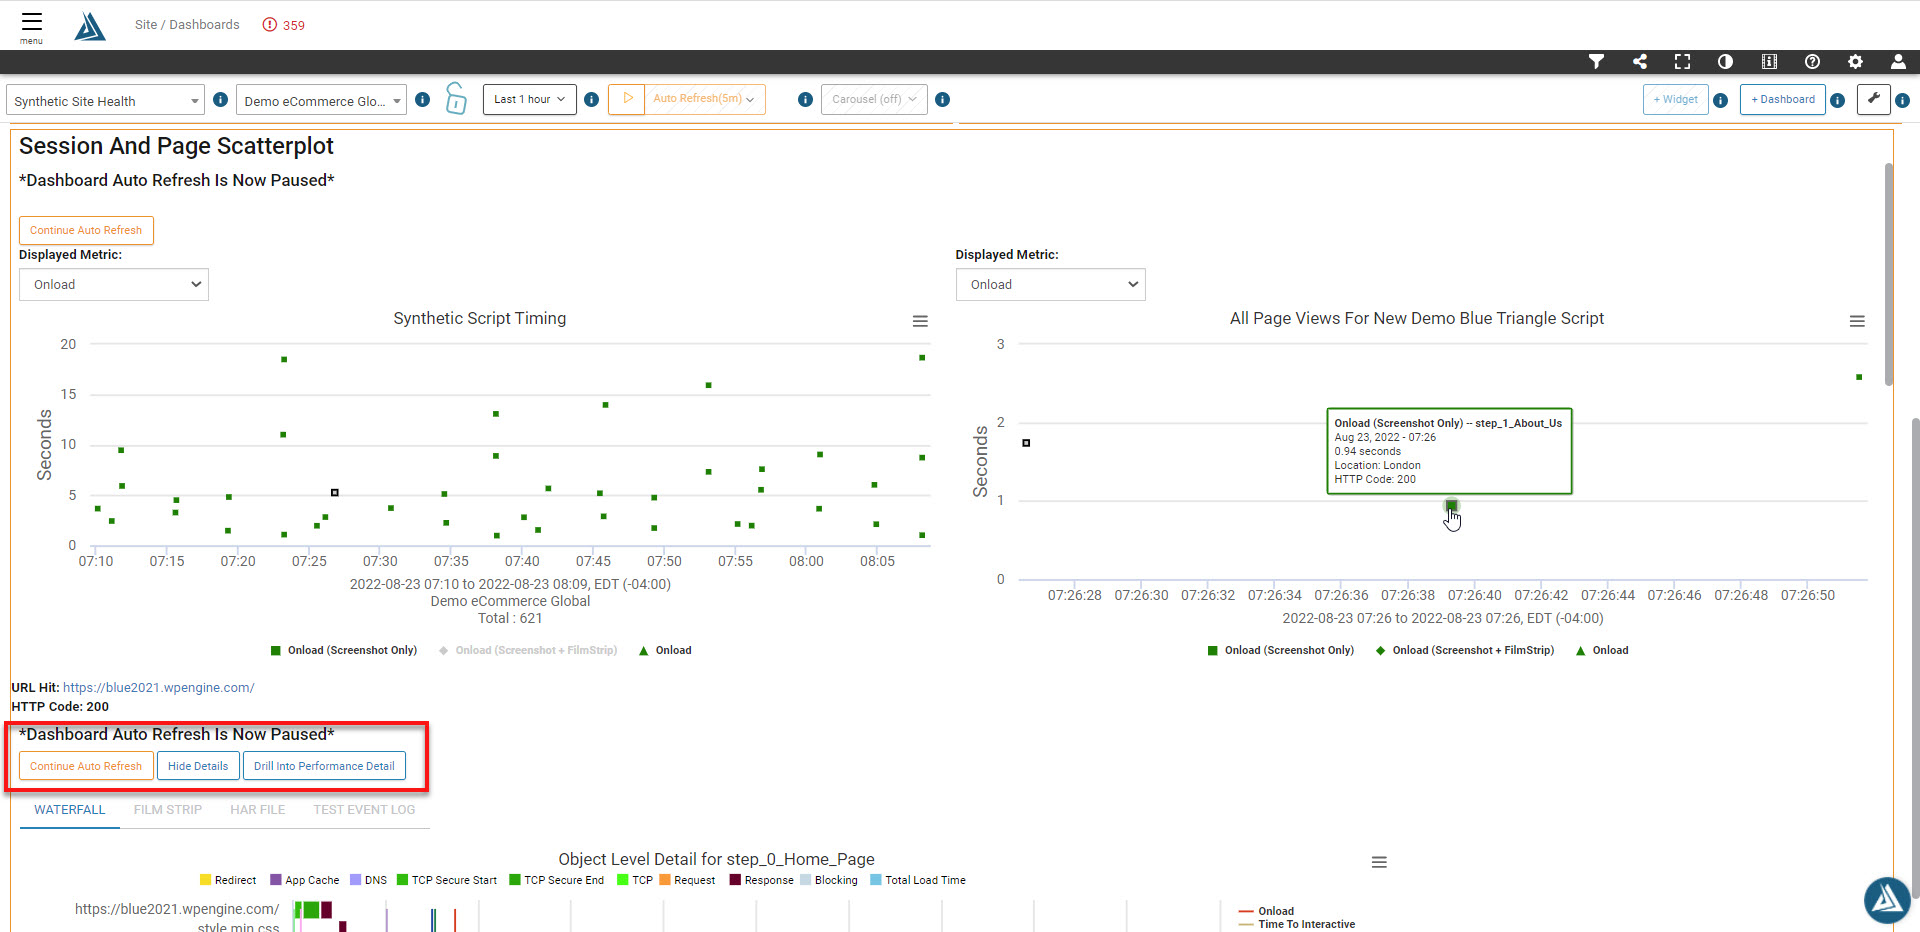
Once you click a scatter plot point in the right, the dashboard will pause so you can analyze the data. From here you have a few options: Continue the auto-refresh functionality of the dashboard, show or hide the detailed data, or drill into the data further on the Performance Detail page of the portal. This will open this page in a new tab with all of your same filter criteria applied.
How to Filter the Synthetic Site Health Dashboard
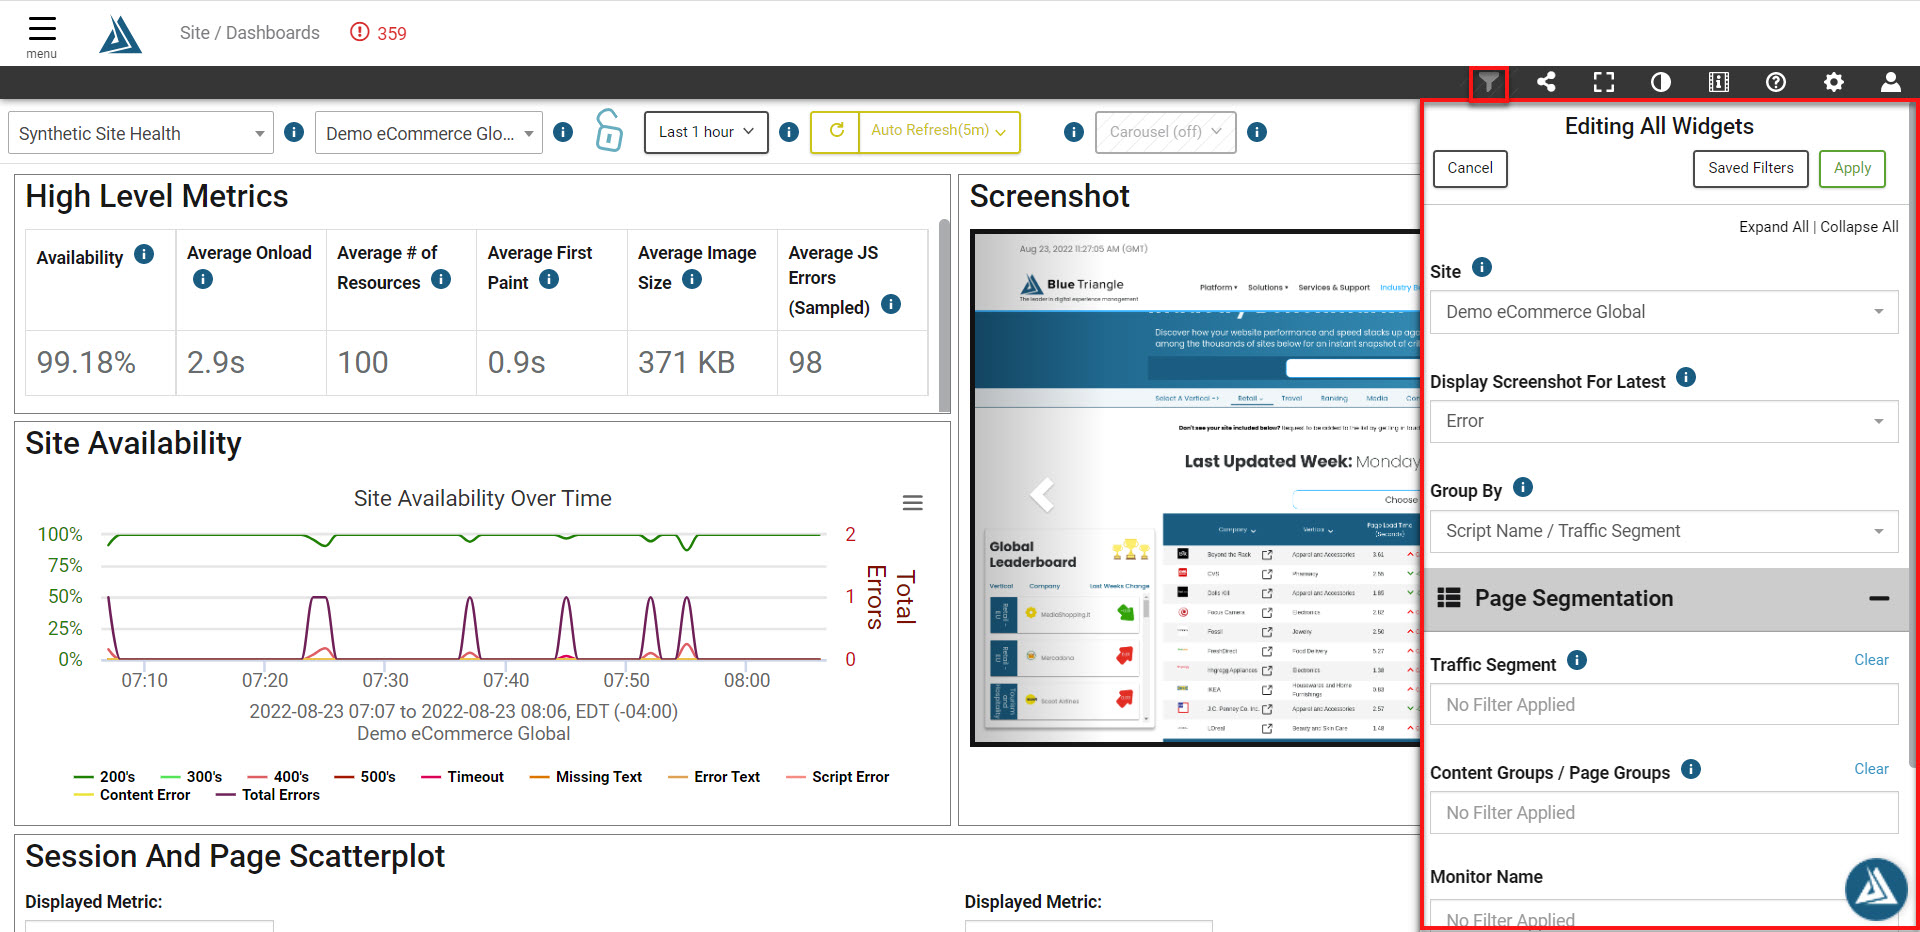
To filter the data, click the Filter icon on the top right of the screen. This will open a menu where you can apply any number of criteria to filter on. Click Apply to reload the dashboard with the new filters.
