Preview:

Details:
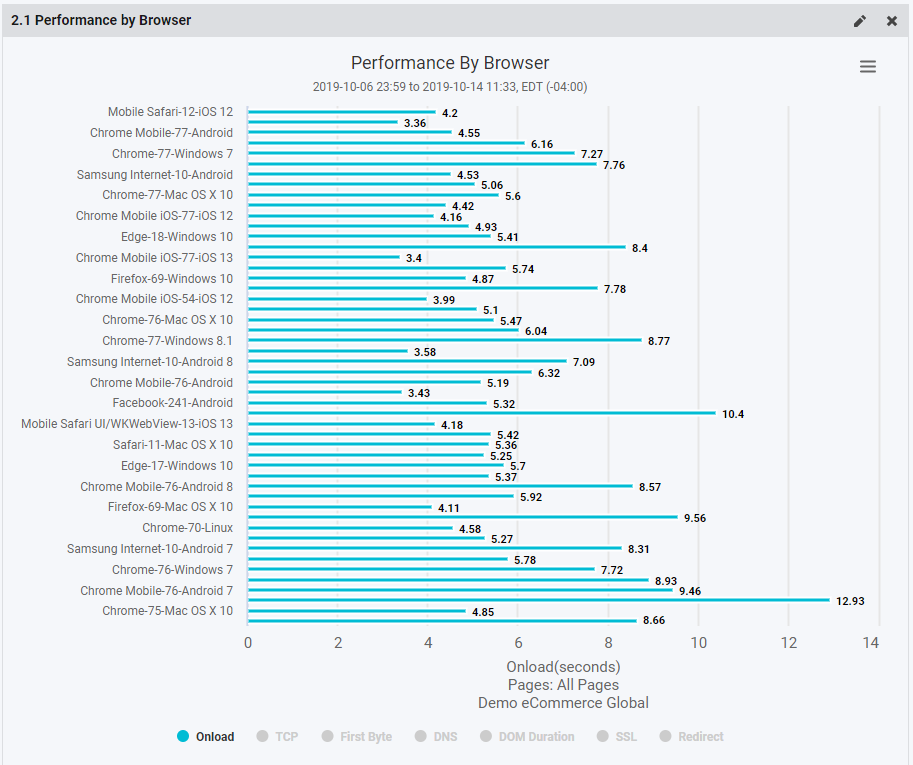
The Performance by Browser Widget allows you to see in real-time the top 50 browser/browser version/OS combinations hitting your site and how they are performing.
The widget is a bar graph and the data is laid out such that each browser/browser version/OS combination has an average performance number (over the Dashboard Time Period) listed for each of the available metrics. The default view shows average Onload.
To hide or show different metrics, click the legend items at the bottom of the widget. They will appear as additional bars in the graph. Note the more metrics you turn on it becomes a little more difficult to read as the space quickly becomes filled with new bars and the text becomes smaller.
Also, the browser/browser version/OS combinations are ordered by traffic, where the items generating the most traffic show at the top.