Preview:
Details:
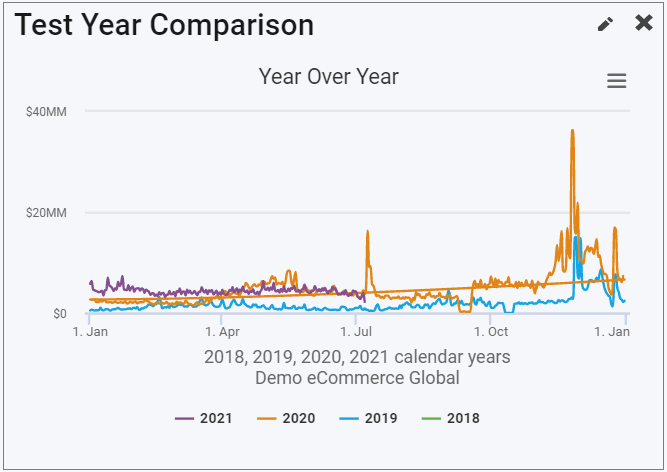
The Year by Year Comparison Widget shows you daily revenue in a line graph for each selected year for comparison. Each year is a separate line in the graph.
Given the graph shows daily data points, this widget updates shortly after midnight each day. It's a good dashboard to have to give you a glimpse at annual revenue trends.
A few things to note about this widget:
- The widget does not abide by and operates independently of the Dashboard Time Period selector at the top of the page.
- Due to the vast amount of data this widget needs to query, the initial load may take upward of 20-30 seconds. Subsequent loads will then be very quick as usual.
