Preview:

Details:
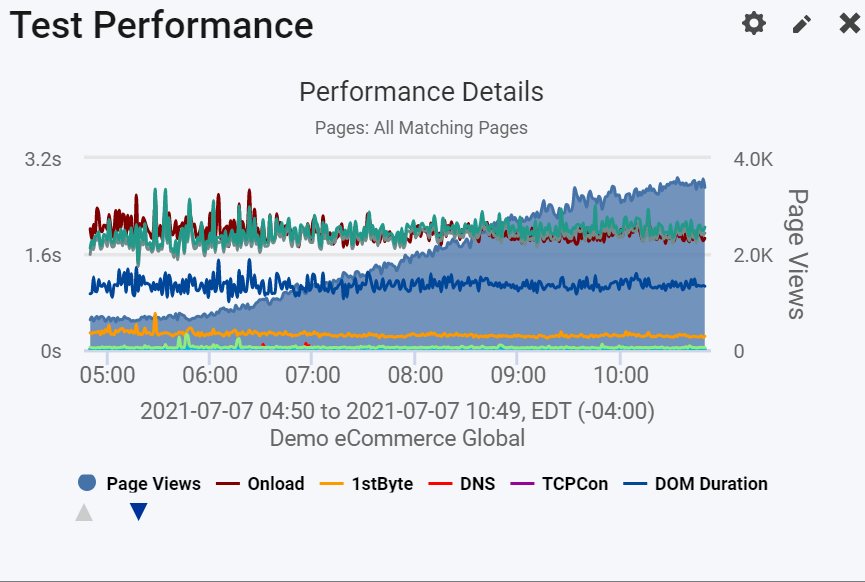
The Performance Widget is the main graph displayed on both the RUM and Synthetic Performance Detail pages. You can choose RUM or Synthetic data for this dashboard widget. This widget is a line graph with various performance metrics displayed over the selected time period.
If you don't want to see all the metrics at once, you can click the legend items to hide/show the metrics in the graph. When applicable, you'll see additional axes appear to support the various metrics in the legend.
The RUM widget has the following metrics:
- Page Views
- Page Onload
- Time to Interactive
- First Contentful Paint
- Largest Contentful Paint
- Total Blocking
- Cumulative Layout Shift
- First Input Delay
- DOM Duration
- Time to DOM Interactive
- Time to DOM Content Loaded
- JavaScript Errors
- First Byte
- DNS
- TCP
- SSL
- Redirect
- Base Page
The Synthetic widget has all of the above metrics plus the following:
- Site Availability over Time
- Page Size (Uncompressed)
- Page Size (Compressed)
- Total # of Elements
- Image Size
- Total # of Domains
For more information on the metrics shown in this widget, please see our glossary.