Preview:
Details:
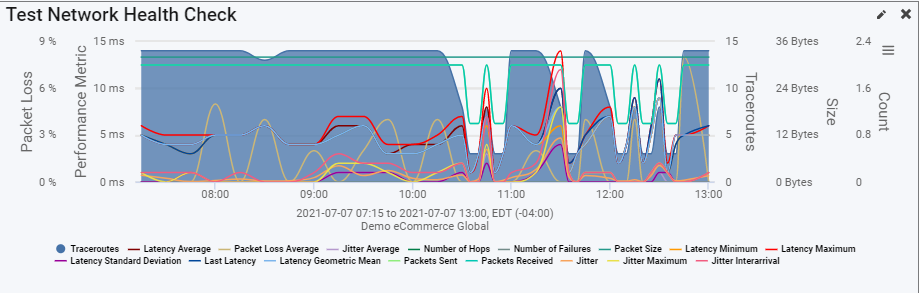
The Network Health Checks Performance Widget is the main graph displayed on the Synthetic Performance Detail page. This widget is a line graph with various performance metrics displayed over the selected time period. The metrics can be toggled on and off by clicking on the individual metric in the legend of the graph. The widget will automatically update the axes of the graph to support the different metrics when toggled.
Metrics:
- Traceroutes
- Latency Average
- Packet Loss Average
- Jitter Average
- Number of Hops
- Number of Failures
- Packet Size
- Latency minimum
- Latency Standard Deviation
- Last Latency
- Latency Geometric Mean
- Packets Sent
- Packets Received
- Jitter
- Jitter Interarrival