Preview:
Details:
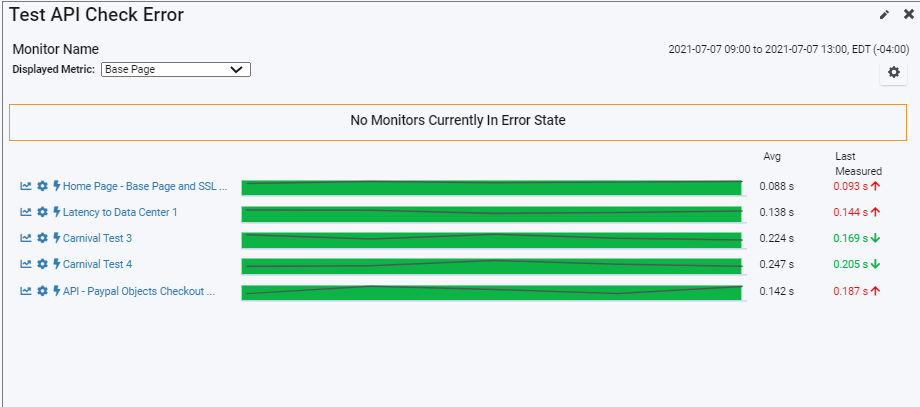
The API Check Error Tracking Widget gives you a great summary of the health and performance of your API Check monitors. The widget lists all of your active monitors along with a performance and availability status bar. There's a variety of configuration and customization options:
Table of Contents:
Widget Configuration:
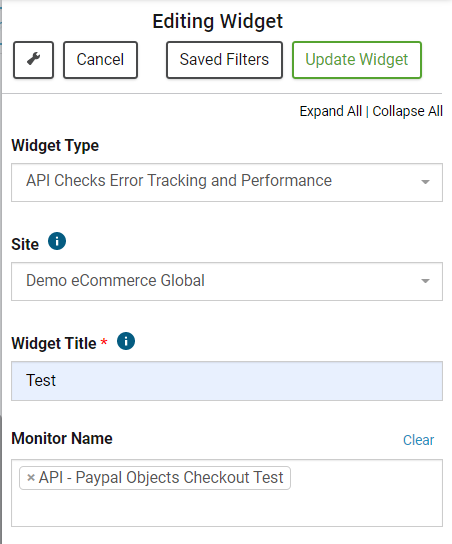
When you first create the widget there are just a few configuration options: The Widget Title and Monitor Name. The Monitor Name filter allows you to filter down the list of monitors you want to appear in this particular widget.
Displayed Metric:
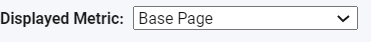
In the widget, the displayed Metric selector allows you to choose which metric is used for the performance line in the bar for each monitor. This is also the metric used to show the average and last measured times to the right of each monitor status bar.
Monitors in Error State:
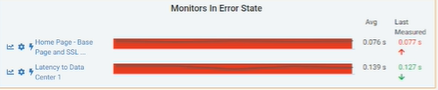
The "Monitors in Error State" section lists the monitors that are currently in error state. In the configuration for each synthetic monitor, there is an "Error Tracking" section for which this dashboard uses to determine whether the monitor is in Error State.
Note the monitors do not "move" from the list into the "Monitors in Error State" section, instead they are duplicated into the section to preserve the ordering and view of the widget.
In-Widget Settings:
If you click the gear icon in the top right of the widget, a few options appears:
Graph Height - Height of each monitor status bar in pixels.
Space Between Graphs - Pixels between each graph
Prioritize Monitors in Error State - Show/Hide the "Monitors in Error State" section
Show Metric Average - Show/Hide the "Avg" column to the right of each monitor status bar.
Monitor Name link

Clicking the Monitor Name will open the Error State Tracking report in a new tab with that monitor selected.
Clicking the pencil icon opens a new page with the monitor configuration in edit mode.
Note: To define the severity of the HTTP codes or custom synthetic error codes in Blue Triangle you can use the Synthetic Codes page.